
What Is AI Observability? Enterprise Stack & Guide for 2026
Most observability stacks only track whether an AI model responded. Almost none check whether the output was accurate, grounded, or fed by quality data. Here is how to build true enterprise AI trust.

TL;DR
- The Production Reality: Traditional Application Performance Monitoring (APM) tracks system health (latency, 200 OK status, GPU memory). However, non-deterministic AI models can throw zero infrastructure errors while quietly returning hallucinations, bias, or factual drift.
- The 3 Signals of AI Observability:
- Infrastructure Signals: Latency, GPU load, error rates (system plumbing).
- Model Telemetry: Token counts, prompt/completion pairs, model temperature (cost & structure).
- Output Quality Signals: Groundedness, hallucination rates, toxicity, and semantic drift (semantic trustworthiness).
- The 5-Layer Stack: End-to-end AI observability spans the Application Layer, Orchestration Layer, Agentic Layer, Model Layer, and Infrastructure Layer.
- Data Observability Is the Root Cause: Over 80% of model output failures stem from upstream data issues like stale vector embeddings, pipeline schema drift, or broken entity resolution. True AI observability requires a governed Data Platform foundation.
Silent AI Failures: Why Healthy APM Dashboards Hide Model Errors
A financial services firm deploys a generative AI assistant to help analysts summarise regulatory documents. The observability dashboard shows healthy response times, near-zero error rates, and consistent throughput. By every operational metric, the system is performing exactly as expected.
Except that the outputs are wrong. The model is quietly hallucinating citation numbers, conflating fund structures, and omitting material risk disclosures. Nobody notices for three weeks; by the time it surfaces in human review, the flawed summaries have already fed dozens of downstream decisions.
Every request came back marked as a success. The system, by every technical measure, was working.
.avif)
AI observability exists because monitoring was built to answer a different question. When infrastructure works, but intelligence quietly degrades, the old dashboards can’t tell you.
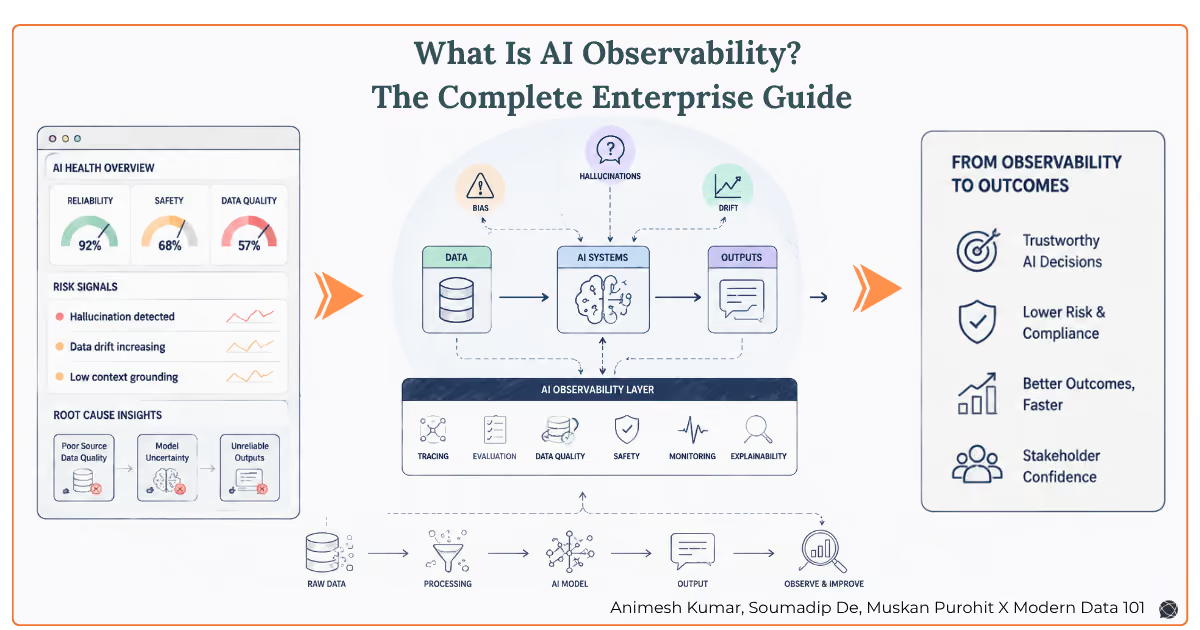
What Is AI Observability? Definition and Core Principles
💡AI observability is the practice of continuously collecting, analysing, and correlating data across AI systems to understand what they are producing, why they are producing it, and whether that output is accurate, safe, grounded, and aligned with the intended purpose.
The term inherits from software engineering, where observability describes the degree to which the internal state of a system can be inferred from its external outputs. In traditional systems, logs, traces, and metrics provide that inference. In AI systems, particularly large language models and autonomous agents, those three pillars are necessary but fundamentally insufficient.
Traditional Monitoring vs. AI Observability: The Core Distinction
The core distinction: Traditional observability asks, did the system respond? AI observability asks, was the response right?
A large language model can return a syntactically perfect, semantically confident response that is factually incorrect, biased, or dangerously off-topic, all while logging success. That gap sits between the model’s confidence and its accuracy, and it demands a different category of tooling.
.avif)
A traditional monitoring alert fires when a threshold is breached: latency spikes, an API times out, a pipeline fails. AI observability works differently. It asks whether the output of an AI system is trustworthy, consistent with its past behaviour, grounded in the data it was given, and safe to act on. None of those questions has a yes/no threshold. They require continuous evaluation, comparative baselines, and semantic judgment capabilities that infrastructure monitoring was never designed to provide.
What makes AI observability genuinely difficult is that the system can be fully operational while silently producing outputs that are wrong, biased, or harmful. In this context, observability is about trustworthiness rather than uptime, and trustworthiness has to be measured, tracked, and maintained over time rather than assumed.
The 3 Telemetry Signals: Infrastructure, Model, and Output Quality
To answer “what is AI observability” completely, it helps to break it down into three signal types:
.avif)
Infrastructure signals are the foundation: request latency and throughput, error rates, GPU/CPU utilisation, memory pressure, and endpoint availability. These are table stakes; every stack should already have them. They tell you the plumbing works; they say nothing about what’s flowing through it.
Model signals are where AI-specific instrumentation begins: token usage by input/output, prompt-completion pairs with version tracking, model version and sampling settings, and for RAG systems, retrieved sources and embedding model version. These give structural visibility for cost attribution and debugging, but still don’t tell you whether the output was right.
Output quality signals are where AI observability diverges most sharply from everything that came before: hallucination rate, faithfulness and groundedness, relevance, semantic drift, toxicity and safety scores, and user feedback signals. This is where the real work happens, and the layer most enterprises are under-instrumented in.
Why AI Observability Matters for Enterprise Leaders
Why this matters belongs equally to business leaders, risk functions, and legal teams, along with engineers. It’s a question of whether an organisation can trust, audit, and defend what its AI systems do in production.
The Cost of Silent Model Failures in Production
The gap between a technically functional AI system and a trustworthy one is wide and invisible without observability. A model that produces plausible summaries isn’t the same as one that produces accurate ones. As AI has moved from experimentation into core enterprise workflows informing credit decisions, drafting legal documents, and managing procurement, the consequences of unmonitored failure have become financial, reputational, and, in regulated industries, legal.
.avif)
Regulatory Compliance and AI Governance Risks
- The Dynatrace State of Observability 2025 report found that 70% of organisations had already increased their observability budgets, with 29% identifying AI capabilities as their top platform selection criterion above cloud compatibility or data collection coverage.
- KPMG reports that 88% of organisations are already investing in building agentic AI into their systems, highlighting how rapidly enterprises are moving from experimentation toward operational deployment.
- Gartner predicts that by 2028, 33% of enterprise software applications will include agentic AI capabilities, up from less than 1% in 2024.
In regulated sectors, unobservable AI creates a compliance problem as much as a technical one:
- Financial services: credit and fraud decisions must be auditable and explainable.
- Healthcare: diagnosis and clinical summarisation need documented validation.
- Legal: A lawyer was already sanctioned for a hallucinatory brief.
- HR and hiring: biased screening outputs carry direct legal exposure.
LLM vs. AI vs. Agent Observability: Key Differences Explained
These terms are often used interchangeably. They should not be. Each refers to a distinct scope, and confusing them leads to observability gaps.
LLM observability measures the behaviour of a single model, completion quality, response consistency, token cost, and hallucination rate. It’s a meaningful starting point for a single model or a small number of features, but it operates at the model-call level. It can’t see the retrieval step, the orchestration logic, or what happens downstream of the response, and for many enterprise use cases, that’s exactly where failures originate.
Related read: https://www.moderndata101.com/blogs/guide-to-llm-evaluation-metrics
AI observability expands the scope to the full system: models, orchestration, data infrastructure, inference infrastructure, and the output-quality signals cutting across all of it. The distinction from LLM observability comes down to accountability as much as scope. It’s the difference between “the model returned a response” and “we know what our system produced, why, and that it’s within defined quality and safety boundaries.”
AI agent observability is purpose-built for autonomous workflows that plan, act, use tools, and maintain memory across sequential steps. What makes it distinct isn’t complexity alone but the nature of failure: a corrupted reasoning step at stage three can cascade silently through the rest of the chain, with every subsequent step logging success. Full agent observability requires capturing the complete decision chain: goals, tool invocations, memory states, and intermediate reasoning, apart from just the final result.
Related Read: Enterprise AI Observability Trends of 2026: Scaling LLMs & Agentic Systems
.avif)
Why Traditional APM Tools Fall Short for Generative AI
Understanding “AI observability vs traditional monitoring” begins with APM, the tools enterprises have relied on for years to track software health. APM watches for errors, latency, and infrastructure strain, and it’s exceptionally good at that. The problem is that AI systems fail in ways APM was never built to detect.
Traditional monitoring assumes determinism: given the same input, a well-functioning service produces the same output. Bugs manifest as errors or latency spikes. Monitoring catches these; alerts fire; engineers investigate. AI systems break that assumption completely.
The Non-Determinism Problem in Probabilistic Software
Large language models are probabilistic by design. The same prompt can produce meaningfully different outputs on consecutive calls.
Unlike deterministic systems where a bug produces consistent failures, LLM failure modes are statistical. A model may perform reliably across thousands of requests and produce a harmful or fabricated output on the next, with no change to the system and no signal in conventional monitoring.
.avif)
A failure can look exactly like a success.
Why Semantic Degradation Fails to Trip Infrastructure Alarms
Consider a request to “summarise the risk factors for Fund A.” The response is well-structured, confident, and grammatically correct. HTTP code 200. Latency 340ms. Status: success.
What monitoring doesn’t see: the summary cited a regulatory threshold from Fund B, omitted a liquidity risk disclosed in section 4.2, and invented a footnote that doesn’t exist in the source document.
This is exactly the kind of failure that compounds over time. Unlike conventional software, where a bug causes consistent failures, AI degradation is gradual and statistical. Without drift detection, a model’s hallucination rate can double or triple over weeks because of a slow statistical shift. Latency stays the same. Error rates stay the same. User satisfaction quietly declines. Without semantic monitoring and output quality tracking, this shift is invisible until it becomes a crisis.
According to MintMCP’s analysis of AI agent observability: “A failure at step three of an eight-step workflow may only manifest as garbage output at step eight. Monitoring sees a successful completion; observability traces the entire decision chain and identifies exactly where context was lost.”
What Are the Core Components of AI Observability?
Knowing that AI systems fail differently from conventional software is one thing. Knowing specifically where to instrument, what to measure, and what each signal means for business trust is another.
The six components below are the distinct failure surfaces that a mature AI observability framework must cover. Each one catches failure modes that the others cannot see. Skip any one of them, and you have a gap in your coverage that will eventually matter.
1. Hallucination Detection and Output Evaluation
The most visible failure mode in any generative AI system is confident fabrication. A model that states incorrect facts in an authoritative tone is not just a quality problem; it is a liability problem, particularly in regulated industries.
Hallucination detection in a mature observability framework goes beyond human spot-checking. It involves:
- Groundedness scoring: comparing model outputs against the retrieved source context to verify each claim is supported
- Factual consistency checks: using secondary models or reference corpora to validate assertions
- Confidence calibration monitoring: tracking whether the model’s expressed confidence correlates with actual accuracy
.avif)
Evaluations are what truly separate LLM observability from everything that came before. A 200 OK status tells you the model responded. A groundedness score tells you whether the response was true.
2. Model Drift Detection
Models do not fail suddenly. They degrade gradually, and without drift detection, that degradation is invisible.
Model drift occurs when a model’s response patterns shift over time in ways that are unintended and often harmful. This can happen because:
- The distribution of incoming user queries changes
- Upstream data sources from which the model was trained or fine-tuned become stale
- The model itself is updated by the provider
- The knowledge base or retrieval index drifts from the training distribution
Key metrics for drift monitoring include changes in output distribution, shifts in semantic coherence scores over rolling windows, and sudden changes in response length or structure that correlate with no identifiable code change.
Drift Detection: What to Track
.avif)
3. Prompt Observability and Version Control
Prompt engineering keeps evolving after launch: system prompts, template variables, and context injection patterns all shift over time. System prompts evolve, template variables change, context injection patterns shift. Without version-controlled prompt logging, teams lose the ability to correlate behaviour changes with the specific prompt modifications that caused them.
Prompt observability involves:
- Capturing every prompt version, including injected variables and context windows
- Logging the output distributions associated with each prompt variant
- Enabling A/B testing across prompt versions with statistical significance tracking
- Tracking the lineage between prompt changes and downstream quality metric shifts
For enterprises running RAG pipelines, this extends to retrieval prompt observability monitoring, not just what the LLM was asked, but what documents were fetched, ranked, and passed as context for each request.
4. Token Usage and Cost Telemetry
Token costs can quietly become one of the largest line items in an AI system’s budget.
As observability practitioner Dotan Horovits noted in Observability for AI Workloads: A New Paradigm for a New Era: In 2025, I watched organizations where a single poorly-optimised prompt could cost more per day than the entire Kubernetes cluster running it.
Cost telemetry in AI observability means:
- Per-request token consumption broken down by input and output tokens
- Cost attribution by workflow, team, user segment, and model version
- Token efficiency metrics (quality of output relative to tokens consumed)
- Budget threshold alerting before spending becomes a problem
This is the layer that makes AI economically governable, a different bar than just being technically observable.
5. Safety, Bias, and Compliance Monitoring
Production AI systems face a category of risk that conventional software never had: they can cause harm without breaking. A model that generates biased loan recommendations, leaks personally identifiable information, or produces toxic content triggers no standard alert, because it’s behaving exactly as designed. The design itself has a problem.
Safety and compliance monitoring in AI observability includes:
- Toxicity and harmful content scoring on both model inputs and outputs
- PII detection to prevent sensitive data from being included in prompts or returned in completions
- Demographic bias auditing across output distributions for different user segments
- Prompt injection detection to identify adversarial input attempts
- Policy violation flagging against defined content policies and regulatory requirements
- Audit trail generation for compliance reporting
For regulated industries: financial services, healthcare, and legal; this layer is what makes AI auditable.
6. Agentic Workflow Traceability and Tool-Call Audit
This is the frontier of AI observability, and the area most enterprises are least equipped for.
As AI systems become autonomous, orchestrating multi-step tasks, calling external tools, maintaining memory, and making sequential decisions, observability needs to span complete execution traces rather than individual model calls.
A single user request can move through several stages before producing a final output:
- A reasoning step
- A retrieval operation
- Three external API calls
- A sub-agent was spawned to handle part of the task
- The final output, synthesised from all of the above
All of this can happen within one logical workflow, and any one of these five steps is where traceability can break down.
Traditional monitoring sees the workflow completed in 2.3 seconds with status 200.
AI observability sees: the reasoning step at stage 4 used outdated context from a tool call that returned stale data, which caused the sub-agent at stage 6 to make a decision based on a false premise, producing a plausible but incorrect final output.
.avif)
Full agentic traceability requires:
- Goal and intent logging for each agent invocation
- Step-level reasoning traces with intermediate outputs captured
- Tool invocation logs, including inputs, outputs, and latency per tool
- Memory state snapshots at each reasoning checkpoint
- Cross-agent dependency mapping for multi-agent workflows
According to IBM’s Institute for Business Value report Agentic AI’s Strategic Ascent (2025), 45% of executives surveyed cited a lack of visibility into agent decision-making processes as a significant implementation barrier.
Where AI Observability Lives in the Stack
How to Instrument AI Observability Across Your Full Technology Stack
Mature AI observability spans five layers, each with its own telemetry and failure modes. Instrumenting without a mental model of where you sit in the stack is how teams end up with strong infrastructure monitoring and no output-quality coverage.
.avif)
- Application layer: where users interact with the system (chat interfaces, feedback widgets). Track interaction patterns, UI-triggered anomalies, feedback ratios, and end-user latency.
- Orchestration layer: where LangChain, LlamaIndex, Semantic Kernel, or custom pipelines coordinate LLM calls and tool invocations. Capture full prompt-response pairs, retry triggers, tool execution paths, and routing decisions.
- Agentic layer: the most complex layer. At each planning step, ep the agent sets goals, retrieves memory, calls tools, and synthesises intermediate outputs, any of which can drift without producing an error. Capture goals, memory state, tool sequences, and intermediate reasoning.
- Model/LLM layer: where inference happens. Capture raw prompts and completions, token counts, model version, temperature, latency, and the quality/safety metrics covered above.
- Infrastructure layer: GPU utilisation, memory pressure, network bottlenecks, inference cost, endpoint availability. The most mature and commonly instrumented layer, it won’t tell you why an output was wrong, but it will tell you whether the environment producing it was under stress.
Why Data Quality Is the Hidden Root Cause of Most AI Observability Failures
.avif)
Here is where most enterprise AI observability frameworks fall short and where the distinction between treating data as a product versus treating it as a pipeline output becomes operationally consequential.
The assumption embedded in most AI observability tooling is that the model is the primary risk surface. In practice, the data feeding the model is often the largest risk and the one with the least instrumentation.
Why Data Quality Degrades AI Output
Consider a RAG-based enterprise assistant. The model itself is fine. But:
- The knowledge base was last indexed six weeks ago
- One of the source documents was deprecated and replaced, but the old version is still in the index
- A schema change in the upstream data pipeline caused three product IDs to be misformatted
- The entity resolution logic that links customer records has a 4% error rate
None of these originates in the model, yet each one causes model outputs to fail. And because the model does not know what it does not know, it will produce confident, well-structured, completely unreliable answers.
.avif)
This is why data observability functions as a precondition for AI observability rather than a parallel concern.
Most AI observability conversations still treat the model as the primary risk surface; hallucination scores and drift detection are built almost entirely around what the LLM produces. That’s backwards. By the time a hallucination shows up in an output, the more useful question was already answered upstream: what was the model fed? A CDO evaluating an AI observability investment gets more from instrumenting the data layer first than from adding another layer of model-output scoring.
What Is Data Observability, and Why It Comes First
Data observability is the practice of tracking the freshness, lineage, schema stability, and quality of the data feeding a system. It’s a narrower, older discipline than AI observability, but without it, AI observability has no way to trace a bad output back to its source.
Four signals matter most:
- Freshness: when a dataset was last updated, and whether that lag exceeds the threshold the AI system needs
- Lineage: where the data originated and what transformations were applied in transit; without it, a degraded output can’t be traced to a specific event
- Schema stability (undocumented structural changes are one of the most common silent causes of AI failures)
- Quality metrics (completeness, accuracy, uniqueness)
When data is managed as a product with embedded quality SLOs, freshness guarantees, and documented ownership, those signals already exist for AI observability to consume. Without that foundation, teams build sophisticated model monitoring on an unreliable substrate and optimise the wrong layer: hallucination rates remain elevated not because the model is bad, but because the knowledge base serving it has drifted.
.avif)
Data Products as the Foundation for Observable AI
In practice, this means the data product itself carries observability metadata that the AI system can read directly, rather than requiring a separate monitoring pass to reconstruct it after the fact. A well-governed data product typically exposes:
- A freshness SLO (e.g., “this dataset is guaranteed current within 4 hours”) that the AI system can check before serving a response
- An ownership contract naming who is accountable when quality drops below threshold, so root-cause investigation doesn’t stall on “whose problem is this”
- A quality score attached at the source, not recalculated downstream, so every consumer of that data, including the AI system, inherits the same trust signal
- Change notifications when schema or lineage shifts, so consuming systems (including AI pipelines) aren’t silently working off stale assumptions
When these are embedded at the data-product layer, AI observability tooling doesn’t have to guess whether a bad output originated upstream, but it can query the data product’s own health metadata and get a direct answer.
Related Read: Data Quality: A Cultural Device
Key AI Observability Metrics You Should Track
A hallucination rate without a defined SLO and escalation protocol is just a number; these are the metrics worth tracking against actual thresholds.
Output Quality Metrics
.avif)
Operational Metrics
.avif)
Drift and Safety Metrics
- Semantic drift score: rolling cosine similarity of output vectors over time; divergence indicates behavioural shift
- Toxicity score: proportion of outputs flagged by safety classifiers
- PII leakage rate: frequency with which personally identifiable information appears in model completions
- Bias indicators: differential output quality or content across demographic groups
Key Challenges of AI Observability Implementation
These challenges surface across organisations at every maturity stage, and share a common thread: none were anticipated at deployment time, because observability was treated as something to add later.
.png)
Challenge 1: Scaling Across a Growing AI Portfolio
Most teams start with one model and one use case; by the time observability becomes a priority, they may have dozens of models and multiple agentic workflows requiring different instrumentation. Address it by standardising on OpenTelemetry-compatible instrumentation early, before portfolio sprawl sets in.
Challenge 2: Monitoring Third-Party and Managed Models
When execution happens on OpenAI, Anthropic, Gemini, or Bedrock, the model’s internal reasoning is structurally opaque; no amount of instrumentation changes that. Focus on what you control instead: prompts, retrieved context, outputs, and usage patterns.
Related read: Machine Learning Model Challenges: From Types and Drift to Enterprise Scale
Challenge 3: The Privacy vs Transparency Trade-off
Logging prompts and completions creates governance obligations most teams don’t plan for, since either can carry sensitive or personally identifiable data. The fix is redacting PII at the logging layer and setting clear retention policies, rather than logging less
Challenge 4: Making Observability Accessible Across Teams
Hallucination scores and drift values are crucial to the engineers who instrument them. To a compliance lead or product manager, they’re abstractions.
The same signal needs a different frame for each: an ML engineer needs to know when to investigate; a compliance lead needs to know whether the system is within regulatory boundaries. Most observability setups are built only for the first audience; closing that gap means building parallel views rather than simplified dashboards.
Challenge 5: Root Cause Analysis in Complex Pipelines
When an output is wrong, the cause could sit in the model, the prompt, the retrieved context, the data, or the orchestration logic and across a five-layer stack, attribution defaults to guesswork without end-to-end tracing.
Monitoring tells you the output was wrong; observability shows you exactly where the reasoning broke. For production AI, that tracing is a baseline, not a premium capability.
Related Read: From Policy to Practice: Making Data Governance Real
Best Practices for AI Observability in Production
The teams that discover problems early and the teams that prevent them differ mainly in sequencing: instrumentation decisions made before deployment, not in response to an incident.
.avif)
- Instrument early, not retrospectively. Retrofitting observability after harmful outputs are already at scale is a crisis response, not design.
- Define quality SLOs before deployment: acceptable hallucination rate, maximum semantic drift, data-freshness requirements, and safety thresholds below which outputs are auto-blocked. Without these anchors, observability data has nothing to compare against.
- Track end-to-end lineage and context, for both the AI system and the data feeding it. Platforms where lineage is a first-class concern cut root-cause analysis from days to minutes.
- Build continuous feedback loops: user feedback should inform evaluation benchmarks, detected hallucinations should drive prompt improvements, and drift signals should trigger retraining decisions. Observability without action is telemetry theatre.
- Integrate governance and compliance monitoring into the same stack rather than bolting it on, so every prompt-completion pair is evaluated for quality, safety, and compliance at once, one audit trail instead of three logs to reconcile.
- Adopt OpenTelemetry standards early, so the observability stack itself doesn’t become a fragmentation problem across model providers and orchestration frameworks.
Related read: The Data Contract Pivot in Data Engineering
How to Implement AI Observability: A Step-by-Step Enterprise Framework
.avif)
Implementation guidance is only useful if it is sequenced correctly. The most common failure mode is not skipping a step; it is starting at the wrong layer. Teams that begin with tooling selection before defining what failure looks like for their specific AI system will instrument the wrong things thoroughly. The framework below works forward from understanding, not backwards from capability.
Step 1: Assess Your Current Coverage
Before adding new tooling, map what you already have:
- Which layers of the five-layer stack are currently instrumented?
- Do you have prompt-completion logging in place?
- Is there any output quality evaluation beyond latency and error rates?
- Does your data pipeline expose freshness and lineage metadata to consuming AI systems?
Most enterprises discover that they have strong Layer 5 (infrastructure) coverage and weak Layer 3–4 (agentic and model quality) coverage.
Step 2: Define What Failure Looks Like
For each AI system in production, document:
- What bad outputs look like (hallucinated claims, irrelevant responses, biased recommendations)
- What is the business impact of those failures
- What the minimum acceptable quality is
Without this, you cannot set thresholds and cannot evaluate whether your observability framework is working.
Step 3: Select Your Instrumentation Approach
The implementation path depends on where your AI stack lives:
For managed API-based models (OpenAI, Anthropic, Gemini), instrumentation focuses on the gateway or orchestration layer. Log prompts, completions, and metadata before and after API calls.
For self-hosted or fine-tuned models: Instrumentation can include inference-layer telemetry, but the principles are the same (capture inputs, outputs, and quality signals consistently).
For RAG systems, instrumentation must extend into the retrieval layer. Log which documents were retrieved, their provenance, their retrieval scores, and whether the final output was grounded in them.
For agentic systems: Full step-level tracing is required. Each tool invocation, reasoning step, and memory access must be captured as a distinct span.
Step 4: Set Up Automated Quality Evaluation
Human review does not scale. The practical path to output quality monitoring at volume is automated evaluation:
- LLM-as-judge: using a secondary model to evaluate the output of the primary model against defined criteria (groundedness, relevance, accuracy)
- Reference-based evaluation: comparing outputs against curated “golden answer” datasets for known query types
- Statistical anomaly detection: flagging outputs that deviate significantly from the established distribution for a given use case
None of these is perfect. Together, they create a coverage that makes manual review targeted rather than comprehensive.
Step 5: Build Dashboards That Drive Decisions
The output of AI observability is decisions, not logs.
- Is this system’s output quality within SLO right now?
- Is there a trend toward degradation that requires investigation?
- What is the cost of this system, and is it efficient?
- Are there safety signals that require immediate action?
- Which prompt version is performing best?
Different stakeholders need different views. ML engineers need raw metric access. Business owners need trend summaries. Compliance teams need audit logs. Design the dashboard architecture accordingly.
Step 6: Establish Response Protocols
Observability without response protocols is noise generation. For each signal type, define:
- Alert thresholds: at what level does this metric trigger an automated notification?
- Escalation paths: Who is responsible for investigating different failure types?
- Automated guardrails: which safety violations should be blocked automatically rather than alerted?
- Investigation runbooks: what does the triage process look like when a quality signal degrades?
What to Look for in an AI Observability Platform
Two criteria matter more than they’re usually given credit for.
- First, OpenTelemetry alignment: the best platforms support OpenTelemetry as a collection mechanism, so AI observability data feeds into existing stacks rather than requiring a parallel system.
- Second, and most commonly missed in evaluations,
- Data-layer integration: the ability to ingest freshness, lineage, and quality-SLO signals from the data layer. Without it, root cause analysis stops at the model and often leads to the wrong conclusion.
Beyond these two, check for audit-trail generation, PII detection and redaction, role-based access control, and retention-policy management.
Related read: Top 5 Data Platforms for 2026
How AI Observability Enables Responsible AI and Regulatory Compliance
AI governance is frequently discussed as a policy concern: what models are permitted to do, what data they can access, what decisions they can influence. Observability is what turns policy into evidence.
The ability to demonstrate:
- That an AI system’s outputs were monitored for bias and safety
- That model drift was detected and investigated within defined SLO windows
- That data feeding the model met the defined quality and freshness standards
- That every agentic decision is traceable to a specific reasoning step
...these are governance requirements, not technical niceties. Observability is the infrastructure that makes them possible.
For enterprises where AI governance is enforced at the data layer rather than bolted on afterwards, where access controls, quality checks, and lineage records are embedded into data products rather than applied, observability and governance share the same instrumentation. The audit trail exists because the data architecture was designed to produce one.
This is the difference between AI governance as a compliance document and AI governance as an operational reality: the former relies on assertions, the latter on evidence.
Related read: Evolving Data Products
AI observability functions as an architectural commitment made before a production deployment, not a feature bolted on after. Observability tells you an AI system is trustworthy; whether the system was worth building in the first place is a separate, and often harder, discipline.
See how enterprises are restructuring their data platforms around that exact question.
FAQs
What is the difference between AI observability and AI monitoring?
AI monitoring tracks whether a system is running with latency, uptime, and error rates. AI observability tracks whether what the system produces is accurate, safe, and grounded, which monitoring alone can’t measure because a wrong output can still return a successful status code.
What is the difference between data observability and AI observability?
Data observability tracks the health of the data feeding a system: freshness, lineage, schema, and quality. AI observability covers the full system, including the model and output quality. Data observability is a precondition for AI observability, not a separate concern.
What are the core components of an AI observability framework?
Hallucination detection, model drift detection, prompt observability and version control, token/cost telemetry, safety and compliance monitoring, and agentic workflow traceability. Each catches a failure mode that the others can’t see.
Do I need AI observability if I’m only using a third-party model like GPT or Gemini?
Yes. You can’t see inside a managed model’s internals, but you can and should observe everything around it: the prompts you send, the context you retrieve, the outputs you get back, and how those change over time.
How is AI observability different for agentic AI systems?
Agentic systems fail in ways single-model observability can’t catch: a bad reasoning step early in a multi-step workflow can cascade silently, with every later step still logging success. Agentic observability requires tracing the full decision chain, not just the final output.
Connect with a community data expert
A no-cost session with a practitioner who's been where you are.
About Modern Data 101
Modern Data 101 is a movement redefining how the world thinks about data. A community built by the same team behind the world’s first data operating system, Modern Data 101 sits at the intersection of data, product thinking, and AI. Spread across 150+ countries, the community brings together a global network of practitioners, architects, and leaders who are actively building the next generation of data systems.
At its core, Modern Data 101 exists to simplify the journey from raw data to tangible and observable impact. It advocates high-potential data systems and next-gen architectures to unify and activate insights and automation across analytics, applications, and operational workflows at the edge.
In a world shifting from data stacks to AI ecosystems, Modern Data 101 helps teams not just navigate the change but lead it.


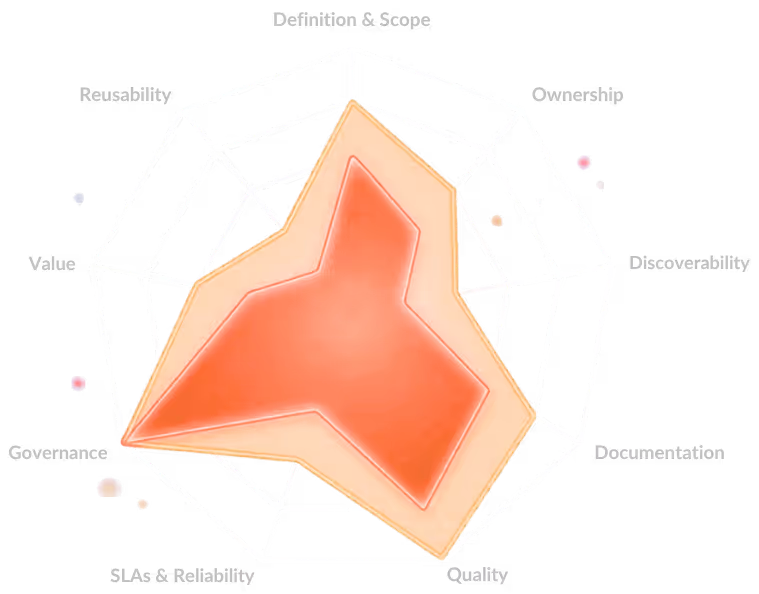
Where does your org stand on data product maturity?
A 9-dimension self-assessment used by 100+ data teams to benchmark strategy, ownership, and platform readiness.


Animesh Kumar
Animesh Kumar is the Co-Founder and Chief Technology Officer at The Modern Data Company, where he leads the design and development of DataOS, the company’s flagship data operating system. With over two decades in data engineering and platform development, he is also the founding curator of Modern Data 101, an independent community for data leaders and practitioners, and a contributor to the Data Developer Platform (DDP) specification, shaping how the industry approaches data products and platforms.

Soumadip De
Soumadip De is an AI Product Manager at The Modern Data Company, working on ontology, context management, and knowledge systems for enterprise AI agents. His work spans data-productisation, context mining, and agentic workflow enablement that help teams move from raw enterprise data to reliable answers and governed action.

Muskan Purohit
Muskan Purohit is a Technical Writer contributing to community projects and tech journalism initiatives on Modern Data 101. She focuses on articulating modern data systems, platforms, and AI-driven architectures. Formerly, she worked with Amazon, training AI models and LLMs in collaboration with data developers. In addition, she has also led projects as a Content Manager @Lead with Tech, driving advocacy across data and technology domains.
Read the ideas here. Build them with The Modern Data Company.
Modern Data 101 is where the data community thinks out loud. When you're ready to move from articles to architecture, data products, governed AI pipelines, or a full Data Operating System; the team behind this community can help you build it.
.png)

.png)

.png)
