ML Model Monitoring: Best Practices to Keep Models Performing in Production

TL;DR
- The Production Crisis: Up to 87% of ML models fail to sustain production performance due to silent data drift, concept drift, and pipeline decay after deployment.
- The Core Solution: To protect production accuracy and ROI, enterprise teams must implement an operational framework focused on establishing pre-launch baselines, enforcing continuous data quality gates, applying statistical drift detection (KS/KL tests), mapping technical accuracy to business KPIs, and leveraging lineage-backed ML observability to trace prediction failures back to root causes in minutes.
- The Bottom Line: Model deployment is the starting gun, not the finish line, sustained AI value requires moving from passive system health checks to proactive, lineage-driven ML observability.
Deploying a machine learning model is actually the starting gun! Once a model enters production, the real world begins to erode its accuracy in ways no test environment can fully predict. User behaviour shifts, data pipelines break, feature distributions drift. And the model you trusted at 94% accuracy starts failing silently.
Industry data underscores the urgency: up to 87% of ML models fail to sustain production performance due to drift, bias, and degradation. For data teams building on modern data platforms, robust ML model monitoring is the operational discipline that bridges the gap between a promising model and reliable business outcomes. This guide covers the best practices drawn from top-ranking resources and validated frameworks.
What Is ML Model Monitoring
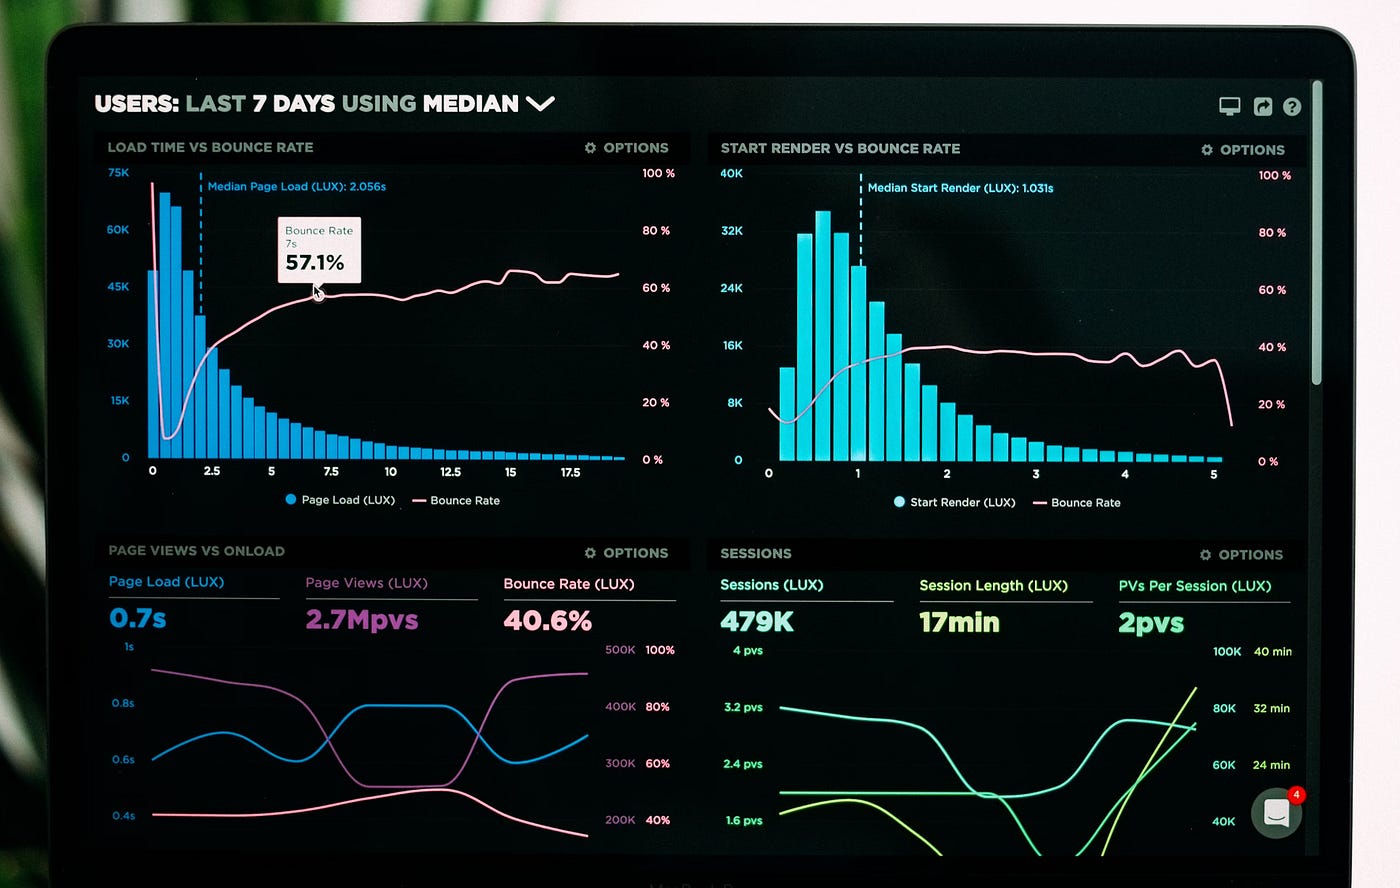
ML model monitoring is the ongoing process of tracking, analysing, and evaluating the performance and behaviour of machine learning models in real-world production environments. Beyond infrastructure health checks, ML model monitoring focuses specifically on whether the model's predictions remain accurate, fair, and business-relevant over time.
Why is ML Model Monitoring Important
Three failure types drive most production model degradation:
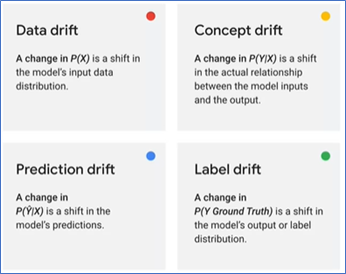
- Data drift (also called covariate drift): shifts in input data distribution compared to training data. A fraud detection model trained on 2023 transaction patterns may struggle with 2025 behaviour.
- Concept drift: changes in the underlying relationship between features and target outcomes, for example, evolving customer intent signals in a churn prediction model.
- Prediction drift: divergence between predicted outputs and observed ground truth labels.
Failing to monitor for these issues leads to inaccurate predictions, compliance violations, and significant reputational risk in high-stakes applications like financial services, healthcare, and automated decision-making.
[related-1]
5 Best Practices for ML Model Monitoring
1. Establish a Performance Baseline Before Deployment
Every monitoring strategy begins with a well-defined baseline. Before a model goes live, document its validation-set performance across all relevant metrics, like accuracy, precision, recall, F1, AUC, and any domain-specific KPIs. This becomes the reference point for detecting degradation later.
Best practice: maintain a model card that records training data characteristics, feature distributions, evaluation results, and known limitations. AI-powered data platforms increasingly support this through versioned metadata management, automatically capturing the state of every data asset, schema, and pipeline artefact at the moment a model is trained.
When a production anomaly surfaces weeks later, that versioned metadata record is what allows teams to pinpoint exactly what changed and when, rather than reconstructing history from memory.
[related-2]
2. Monitor Data Quality Continuously (Not Just Model Outputs)
A model’s predictions are only as good as the data flowing into it. Data quality monitoring is the first line of defence: catching null value spikes, schema changes, encoding errors, and upstream pipeline failures before they corrupt predictions.
Key data quality metrics to track in production:
- Feature completeness and null rates per column
- Value range violations against training-time bounds
- Categorical cardinality shifts (new values not seen in training)
- Data freshness and pipeline latency
Research demonstrated that integrating real-time data quality assessment with drift detection in an MLOps pipeline yielded a 12% improvement in model performance and a fourfold reduction in prediction latency in industrial settings.
Optimised data platforms address this by embedding data quality checks directly into the data pipeline layer, not as a separate audit step, but as a continuous gate that runs every time data moves. When quality metrics fall outside acceptable bounds, the platform surfaces alerts and traces the issue back through the data lineage graph to the originating source.
This end-to-end visibility, from raw ingestion to model prediction, is what separates reactive debugging from proactive quality governance.
3. Implement Drift Detection with Statistical Rigour
Drift detection requires choosing the right statistical test for the right data type. Important indicators that the right approaches should have are the ability to measure how much production data distributions differ from the training baseline.
.avif)
Set threshold-based alerts so that when drift exceeds a defined tolerance, the team is notified automatically. The governance framework needs to focus on mapping each monitored metric to an explicit business risk, because not all drift is equally costly. A small shift in a low-stakes recommendation feature matters far less than equivalent drift in a credit risk score.
The infrastructure underpinning this practice matters enormously. Platforms that support declarative monitoring resources, where teams define alert conditions, thresholds, and notification channels as configurable policies rather than custom code, make drift detection sustainable at scale. Instead of engineers maintaining bespoke monitoring scripts per model, the platform manages the alerting layer centrally, with each monitor tied to a specific data asset or metric.
4. Track Business KPIs Alongside Technical Metrics
A common mistake is monitoring only technical model metrics (accuracy, RMSE) while ignoring downstream business impact. A model can maintain statistical accuracy while quietly degrading on the metrics that actually matter to stakeholders.
Align monitoring dashboards to business outcomes:
- Revenue impact of prediction errors
- Customer churn attributed to poor recommendations
- False-positive rates in fraud detection and their operational cost
- SLA breaches caused by model latency
.avif)
This approach, sometimes called “business-aligned observability”, ensures that ML monitoring is not just an engineering exercise but a business continuity practice.
Platforms that unify model metadata with business domain taxonomies make this linkage tractable. When a data product is tagged to a business domain and ownership is assigned at the platform level, monitoring alerts automatically route to the right stakeholders like data scientists, product owners, and compliance teams, without requiring manual coordination.
5. Build Observability, Not Just Monitoring
Monitoring tells you that something went wrong. Observability helps you understand why. The distinction matters at scale.
Observability for ML models includes:
- Feature importance tracking over time (which inputs drive predictions today vs. at launch)
- Prediction confidence distributions and uncertainty quantification
- Slice-based performance breakdowns by segment, cohort, or time window
- Root-cause logging that links a prediction failure back to a specific upstream data event
Several organisations have invested in or plan to invest in ML solutions, yet most lack the observability infrastructure to debug production failures quickly. The gap between monitoring and observability is typically a data lineage problem: teams can see that accuracy dropped, but cannot trace which upstream data source, transformation, or schema change caused it.
Platforms with native lineage graphs, where every data asset, workflow, and model artefact is connected in a queryable topology, close this gap. When an alert fires, the on-call engineer can traverse the lineage from the failing prediction back through the feature pipeline to the source system, often in minutes rather than hours. That speed of diagnosis is what separates an MLOps team operating at maturity from one perpetually in reactive firefighting mode.
A Monitoring-First MLOps Culture
The most effective ML monitoring programs are designed into the model lifecycle from day one. The continuous loop of data collection to training to deployment to monitoring to retraining is what keeps models useful in a dynamic world.
The platform layer is what makes this loop sustainable. When data quality checks, drift alerts, lineage tracking, workflow orchestration, and access governance are unified in a single AI-powered data platform, rather than stitched together from disconnected point tools, the monitoring-first culture becomes an operational default rather than a heroic effort. Teams spend less time wiring infrastructure and more time interpreting signals and improving models.
Key organisational enablers remain constant regardless of tooling:
- Shared ownership of model health between data scientists and ML engineers
- Clear escalation paths from automated alerts to human review
- Regular model performance reviews tied to business reporting cycles
- Documentation standards that capture monitoring decisions alongside model decisions
FAQs
Q1. What causes ML models to degrade in production? Three main culprits: data drift (input distributions shift from training), concept drift (the real-world relationship between features and targets changes), and prediction drift (outputs diverge from observed ground truth).
Q2. What’s the difference between ML monitoring and ML observability? Monitoring tells you that something went wrong, a metric crossed a threshold. Observability tells you why, by tracing the failure back through data lineage, feature pipelines, and upstream sources.
Q3. What statistical tests are used for drift detection? The Kullback-Leibler (KL) divergence and Kolmogorov-Smirnov (KS) test are the most widely used, KS for continuous distributions, KL for comparing probability distributions more broadly.
Connect with a community data expert
A no-cost session with a practitioner who's been where you are.
About Modern Data 101
Modern Data 101 is a movement redefining how the world thinks about data. A community built by the same team behind the world’s first data operating system, Modern Data 101 sits at the intersection of data, product thinking, and AI. Spread across 150+ countries, the community brings together a global network of practitioners, architects, and leaders who are actively building the next generation of data systems.
At its core, Modern Data 101 exists to simplify the journey from raw data to tangible and observable impact. It advocates high-potential data systems and next-gen architectures to unify and activate insights and automation across analytics, applications, and operational workflows at the edge.
In a world shifting from data stacks to AI ecosystems, Modern Data 101 helps teams not just navigate the change but lead it.


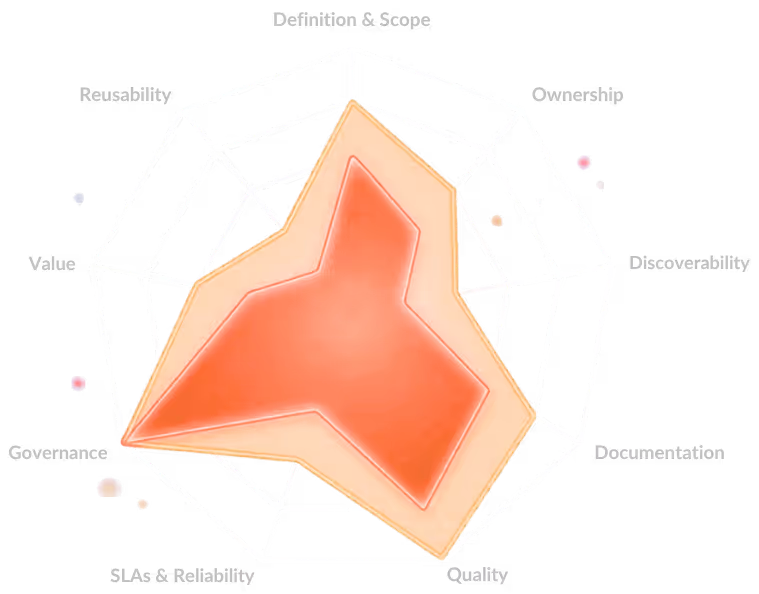
A 9-dimension self-assessment used by 100+ data teams to benchmark strategy, ownership, and platform readiness.


Rachana Medishetti
Rachana is a data engineer with 5+ years of experience with a deep passion for how businesses leverage data, focusing on building end-to-end data systems, from ingestion and pipelines to analytics. She is skilled in PySpark, SQL, Python, and Snowflake, focused on turning data into reliable, real-world business value.
Read the ideas here. Build them with The Modern Data Company.
Modern Data 101 is where the data community thinks out loud. When you're ready to move from articles to architecture, data products, governed AI pipelines, or a full Data Operating System; the team behind this community can help you build it.
Continue reading
.png)