

Access full report
Oops! Something went wrong while submitting the form.

🤍

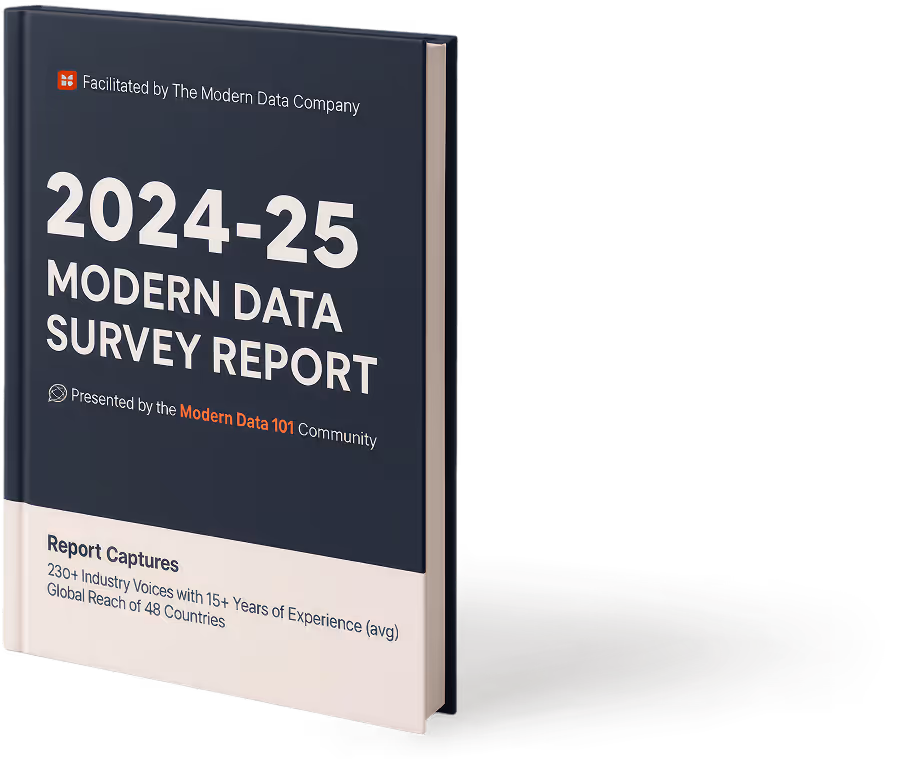
Facilitated by The Modern Data Company in collaboration with the Modern Data 101 Community
Latest reads...

%20(1).png)

.png)
TABLE OF CONTENT


.avif)

The new urgency for data observability is here.
Data pipelines power decisions, automation, and AI experiences that define how modern businesses operate. But when those pipelines fail, they often fail silently. A missed update, a schema drift, or a broken lineage can cascade through dashboards and models before anyone notices.
Traditional “monitoring” approaches, built for static systems, can’t keep up with the speed and complexity of today’s hybrid, distributed data environments.
Data observability has emerged as the answer: a discipline that gives teams visibility into the health, reliability, and behaviour of their data ecosystems. It’s how organisations detect anomalies before they disrupt workflows and trace issues back to their source with confidence.
As data increasingly behaves like a product and AI becomes one of its largest consumers, observability can no longer be an afterthought; it has to be built into the very fabric of the platform that manages and serves that data.
[data-expert]
Data observability is defined as the process that allows teams to understand, diagnose, monitor, and manage the overall health of their data systems across the entire lifecycle.
This allows a team to obtain a complete view of how data is flowing, transforming, and behaving, from its source to consumption.
Instead of focusing only on whether pipelines are running, observability helps uncover why something went wrong and where it originated.
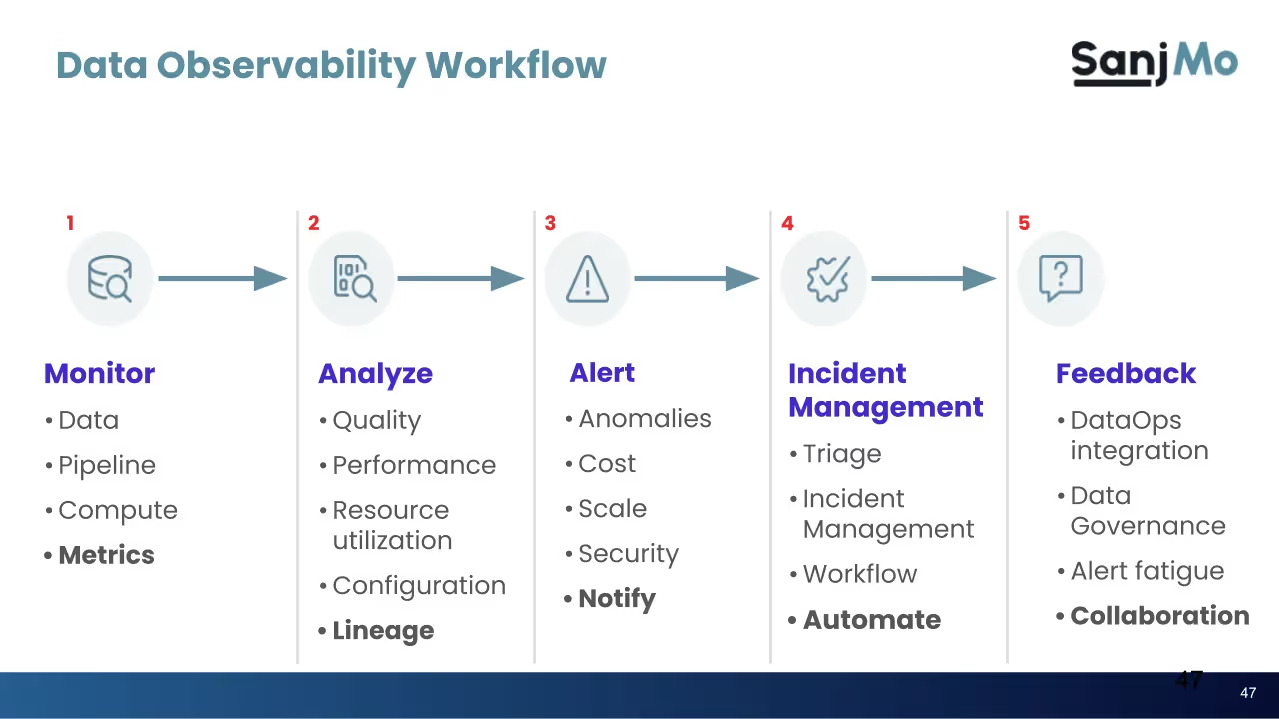
The foundation of data observability rests on five key pillars that collectively define the health and reliability of data systems. Each of these pillars provides a specific lens into how data is interacting across complex and distributed pipelines.
[related-1]
Data observability and data governance serve different but complementary purposes.
On the one hand, where Observability focuses on system behaviour, detecting, diagnosing, and preventing issues in data pipelines, Governance focuses on policy and control, defining ownership, access, and compliance rules.
Observability makes governance operational by providing real-time visibility into how data is created, transformed, and consumed. Governance, in turn, gives observability its context and helps clarify who’s accountable and what standards define “good” data.
Data observability and governance work hand in hand to form a feedback loop: observability enforces trust through transparency, and governance sustains it through accountability.
.avif)
Data observability is ultimately about giving your data ecosystem the ability to see itself. It does this by continuously capturing and stitching together signals, logs, metrics, traces, and metadata, so every movement of data is visible with its full behavioural context. Instead of treating anomalies as isolated events, observability turns them into explainable assets, like, what changed, where it originated, and which downstream data products or dashboards felt the impact.
The real value is generated when this visibility is paired with context and automation. By correlating signals across systems, observability leads to causality, so a freshness drop in one source instantly explains a KPI spike somewhere else. Layer in automation and you get early detection, pattern recognition, and self-healing pipelines.
And as AI workloads are embedded as a part of the pipeline, observability now enables tracking data drift, model drift, and trust signals end-to-end. This is how modern data teams move from firefighting to running a self-diagnosing, continuously reliable data ecosystem.
Read more on distributed tracing in the AI landscape here.
For enterprises, data observability becomes an enabler of trust, agility, and operational scale across the data ecosystem. When built into the platform, it transforms how teams manage reliability, performance, and governance.
Real-time telemetry across pipelines, systems, and models enables teams to detect anomalies before they cascade. So instead of responding to broken dashboards or failed jobs, observability allows surfacing root causes that reduce downtime and accelerate recovery.
By continuously validating data quality, lineage, and schema consistency, observability ensures teams use trusted data, building confidence in the datasets that power analytics, AI models, and operational systems.
Transparent lineage and impact analysis break down the silos between data engineering, analytics, and governance teams. So when cross-domain teams see where an issue originates and how it propagates, ownership becomes clearer, and collaboration becomes faster.
Telemetry on data volume, query performance, and resource utilisation enables optimising cost without any guesswork. Observability helps teams align compute and storage to actual business usage patterns.
As AI observability evolves, it extends this visibility to monitor model drift, data drift, and inference performance. The result is an ecosystem where both data pipelines and AI models can self-heal and scale reliably.
Learn more about AI-ready data here.
Despite growing awareness, most organisations still struggle to operationalise data observability at scale. The core issue is the fragmentation between them. Quality checks live in one place, lineage maps in another, and monitoring dashboards somewhere else. As a result, there is a patchwork of insights without a unified view of what’s actually happening across systems.
Ownership is another gap. When observability isn’t embedded in the platform, it's ownership isn't well-defined. Data engineers, analysts, and ML teams each monitor fragments of the stack, but accountability for system-wide reliability often falls through the cracks.
As data volume and velocity grow, manual thresholds and static rules fail to adapt. Tools built for yesterday’s batch systems can’t keep up with real-time, hybrid architectures.
Add to that the loss of context, most observability tools can’t trace dependencies across domains or environments, and you end up diagnosing symptoms, not causes.
These challenges underline a simple truth: observability needs a platform-based foundation, not another layer of tools.
Learn how data observability becomes key for optimising data analytics, here.
The Data Product Platform (DPP) is built on the foundation of the Data Developer Platform (DDP), which treats data as a first-class product, not an afterthought. This changes how observability is designed and delivered.
Traditional observability tools sit on the sidelines, collecting logs, metrics, and traces after systems are deployed, hoping to piece together what went wrong. A Data Product Platform flips that model entirely. Observability isn’t a bolt-on; it’s built into how the platform behaves.
Every data product carries its own instrumentation by default.
Observability is embedded directly into the lifecycle of every data product. Each transformation, API call, access event, or model inference generates structured telemetry and metadata as part of the platform’s usual operation.
This metadata defines the lineage as a dynamic map that evolves with your data ecosystem. It traces dependencies, transformations, and consumption paths automatically. The result: when something breaks, you can pinpoint why, where, and who in seconds.
Trust is continuously propagated by the platform itself.
The self-service infrastructure of a data product platform continuously analyses behavioural signals, from volume shifts and schema drifts to dependency anomalies.
AI agents within the platform act as intelligent observers, not just alarm systems. They detect deviations, correlate them with lineage, and recommend or even trigger automated remediations.
Data quality becomes a native property of every product. Consumers no longer ask if a dataset is reliable, as the platform provides that assurance as part of its metadata contract.
The DPP extends observability beyond pipelines into the AI layer. It unifies data lineage, drift detection, and model performance telemetry, giving teams a single plane of visibility across the full data-to-AI lifecycle.
By linking data quality to model outcomes, the platform ensures explainability and accountability in AI systems.
Here, observability is a system property, continuously emitted, interpreted, and improved by the platform itself.
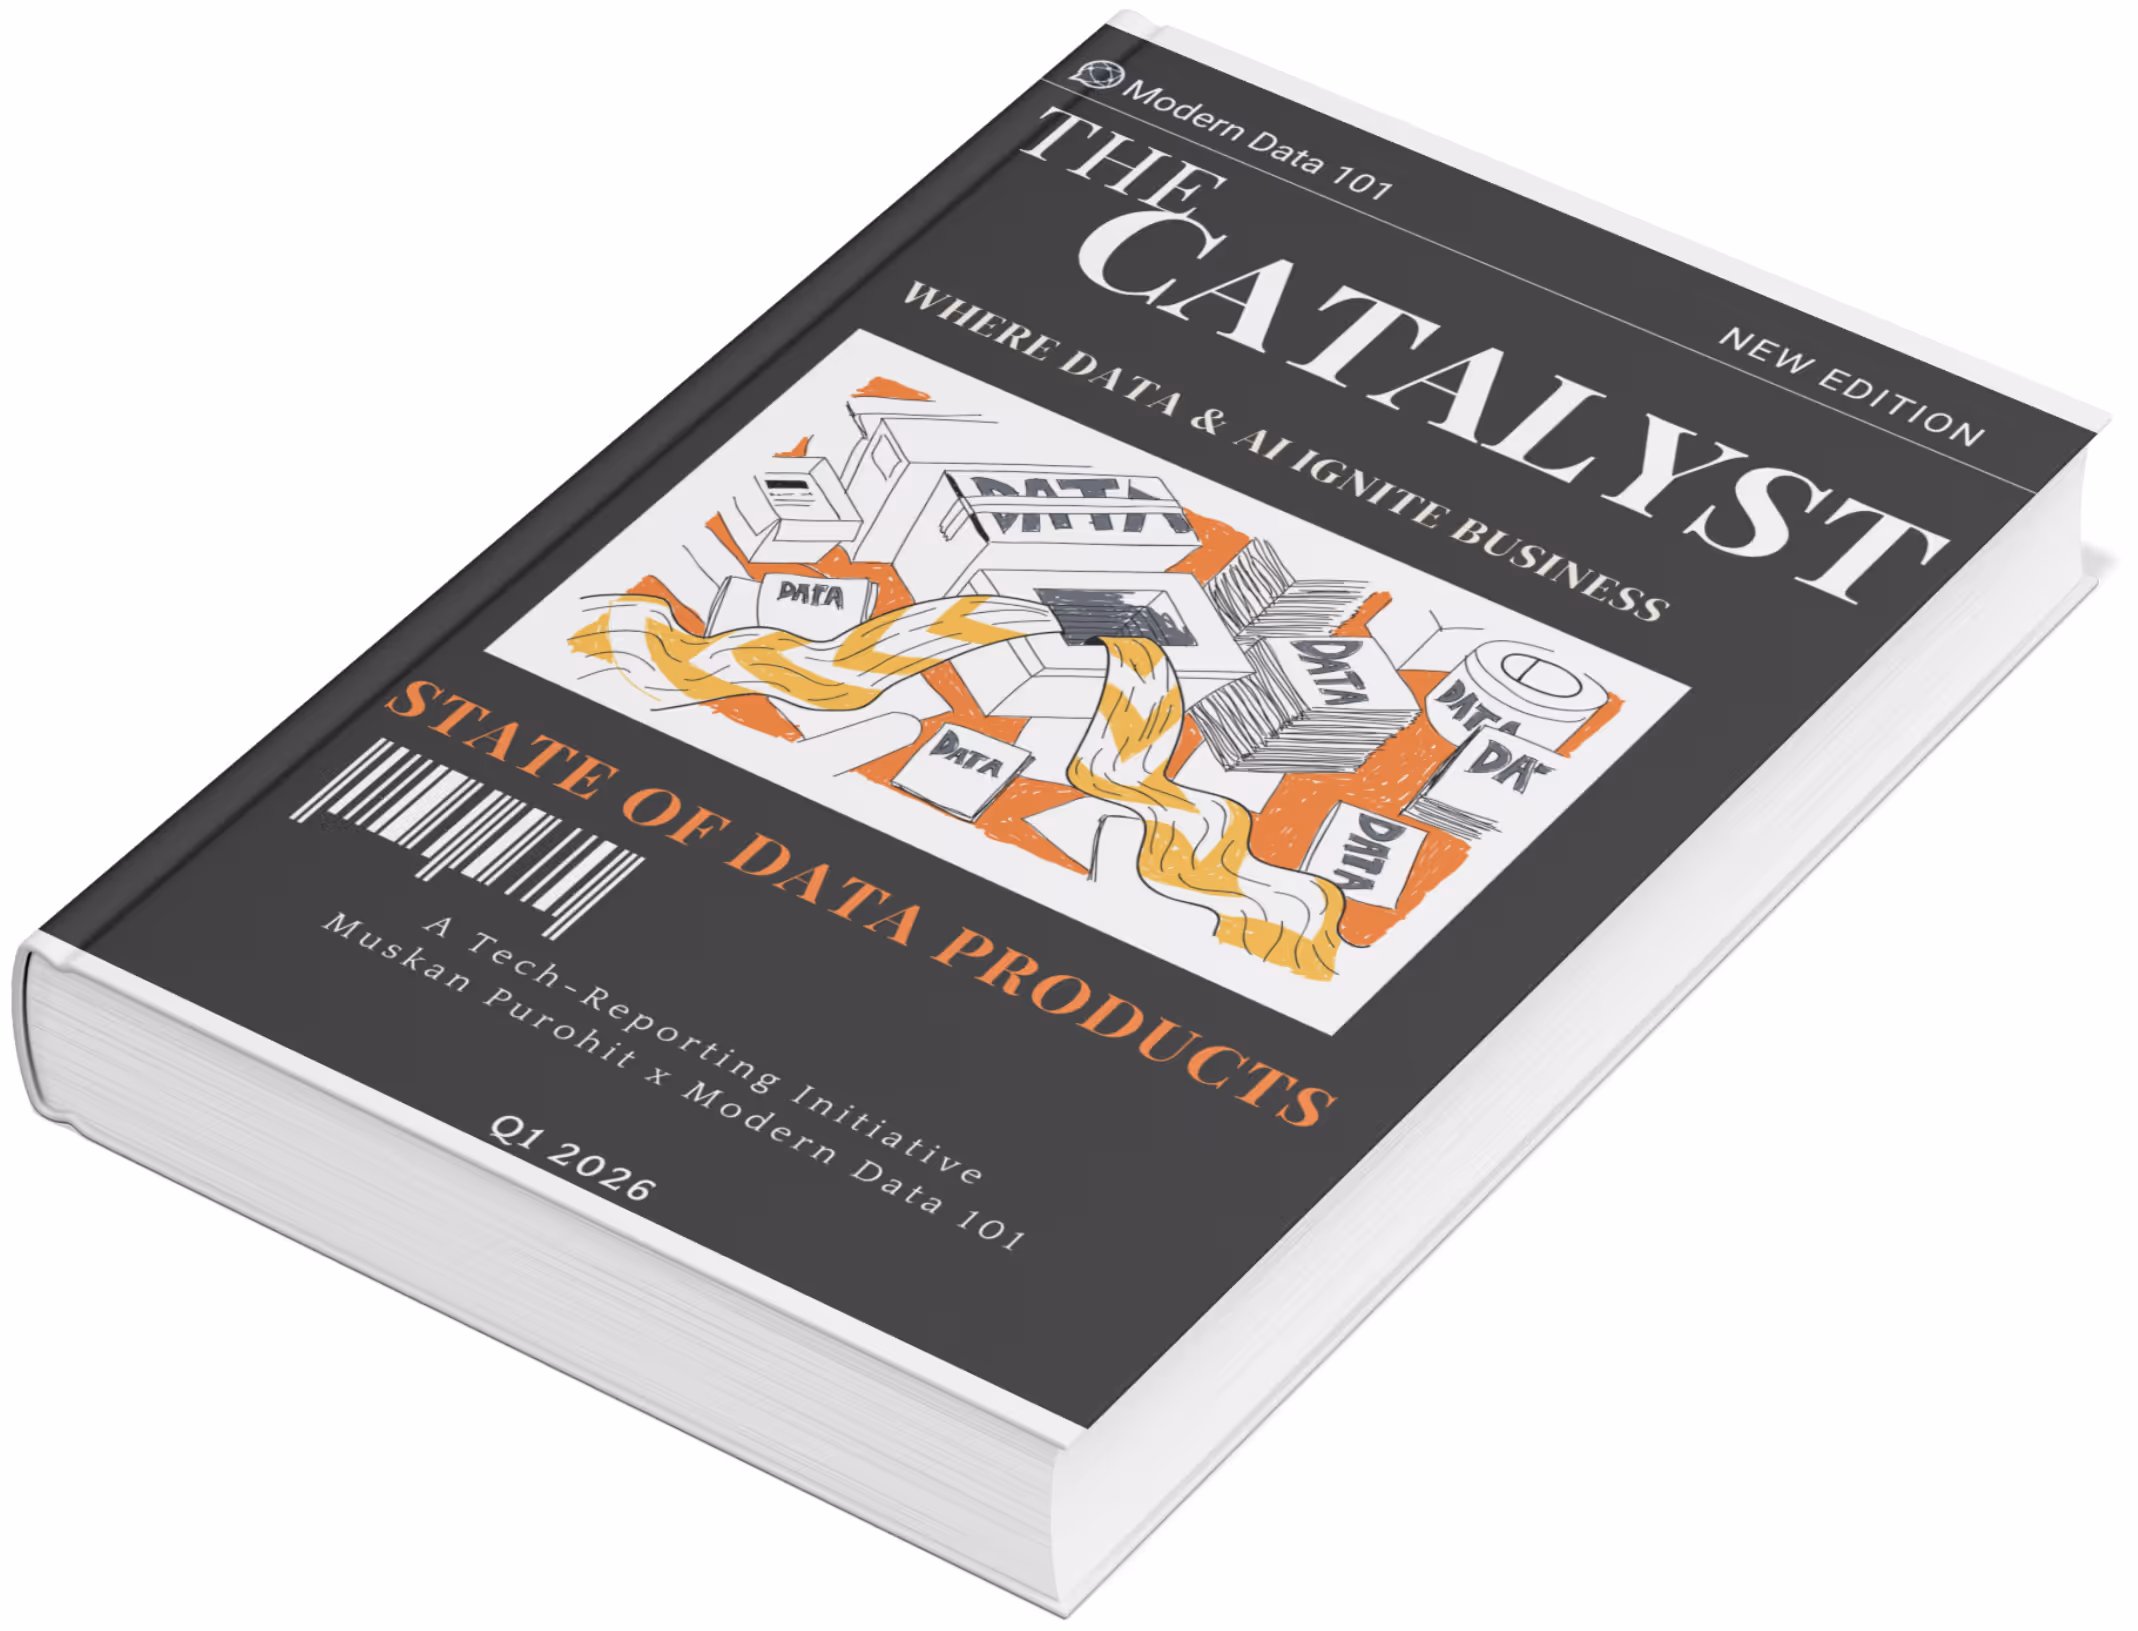
[state-of-data-products]
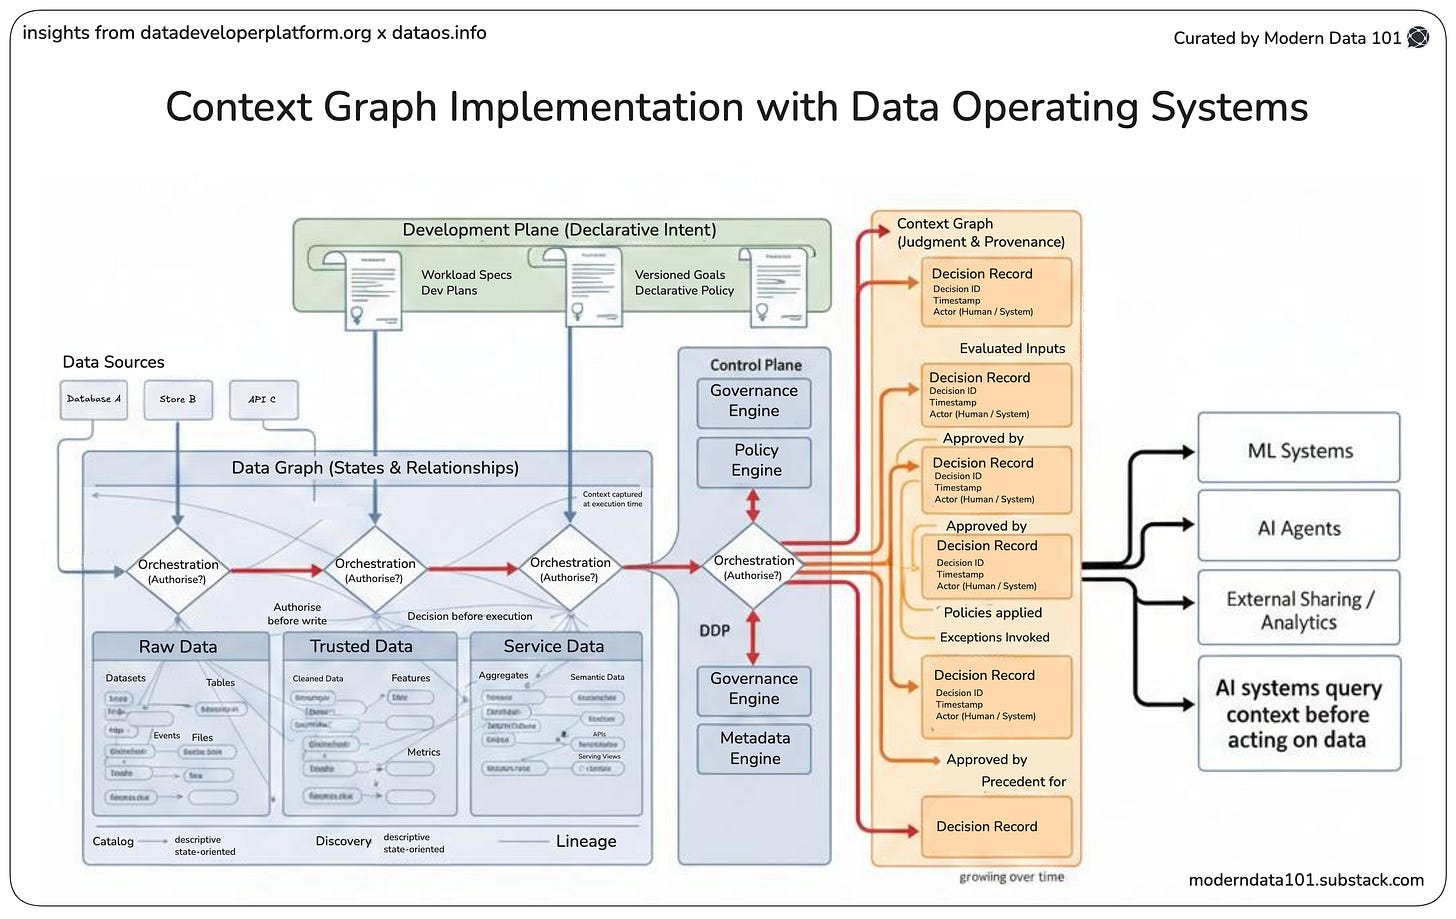
Traditional lineage tooling is often passive and disconnected: it shows what changed, but not why, and lacks ownership and context. So when you organise your data as data products, “modular, use-case-specific outputs with clear owners and interfaces,” then lineage becomes designed, not accidental.
Each data product becomes a boundary, with explicit input/output interfaces and an owner. Metadata moves from being buried to being embedded, so lineage includes narrative context (purpose, owner, use case) as well as flow.
With modular products, the lineage graph becomes meaningful (business-readable) rather than a tangle of pipelines; this enables clearer impact analysis.
For AI or feature/ML pipelines, lineage is essential for feature provenance, root-cause diagnosis of model drift, and regulatory defence.
The three types of observability are logs, metrics, and traces. Logs capture detailed event data, metrics provide quantitative system indicators, and traces show how data flows across components. Together, they help teams pinpoint issues, monitor performance, and ensure data products behave as expected end-to-end.
Data quality measures the health of data, its accuracy, completeness, and consistency. Data observability monitors the behaviour of data, how it moves, transforms, and interacts across systems. Quality tells you what’s wrong with the data; observability helps you understand why it went wrong and where to fix it.
Some of the most popular data observability tools include Acceldata, Datadog, Bigeye, Cribl, and IBM Databand. These platforms help monitor data freshness, volume, schema, lineage, and quality, giving teams real-time visibility into pipeline health, anomalies, and dependencies across hybrid data systems.
Monitoring is about tracking predefined metrics and alerts to detect when something goes wrong. Eg: question: “Is my system working as expected?”
Observability, on the other hand, addresses why something is happening. It involves collecting and correlating logs, metrics, and traces to uncover the root cause of issues, even those you didn’t anticipate.
Your Copy of the Modern Data Survey Report
Better decisions start with shared insight.
Pass it along to your team →
Your Copy of the Modern Data Survey Report
Better decisions start with shared insight.
Pass it along to your team →


Find more community resources
Modern Data 101 is a movement redefining how the world thinks about data. A community built by the same team behind the world’s first data operating system, Modern Data 101 sits at the intersection of data, product thinking, and AI. Spread across 150+ countries, the community brings together a global network of practitioners, architects, and leaders who are actively building the next generation of data systems.
At its core, Modern Data 101 exists to simplify the journey from raw data to tangible and observable impact. It advocates high-potential data systems and next-gen architectures to unify and activate insights and automation across analytics, applications, and operational workflows at the edge.
In a world shifting from data stacks to AI ecosystems, Modern Data 101 helps teams not just navigate the change but lead it.

Find all things data products, be it strategy, implementation, or a directory of top data product experts & their insights to learn from.
Connect with the minds shaping the future of data. Modern Data 101 is your gateway to share ideas and build relationships that drive innovation.
Showcase your expertise and stand out in a community of like-minded professionals. Share your journey, insights, and solutions with peers and industry leaders.


