


Access full report
Oops! Something went wrong while submitting the form.

🤍

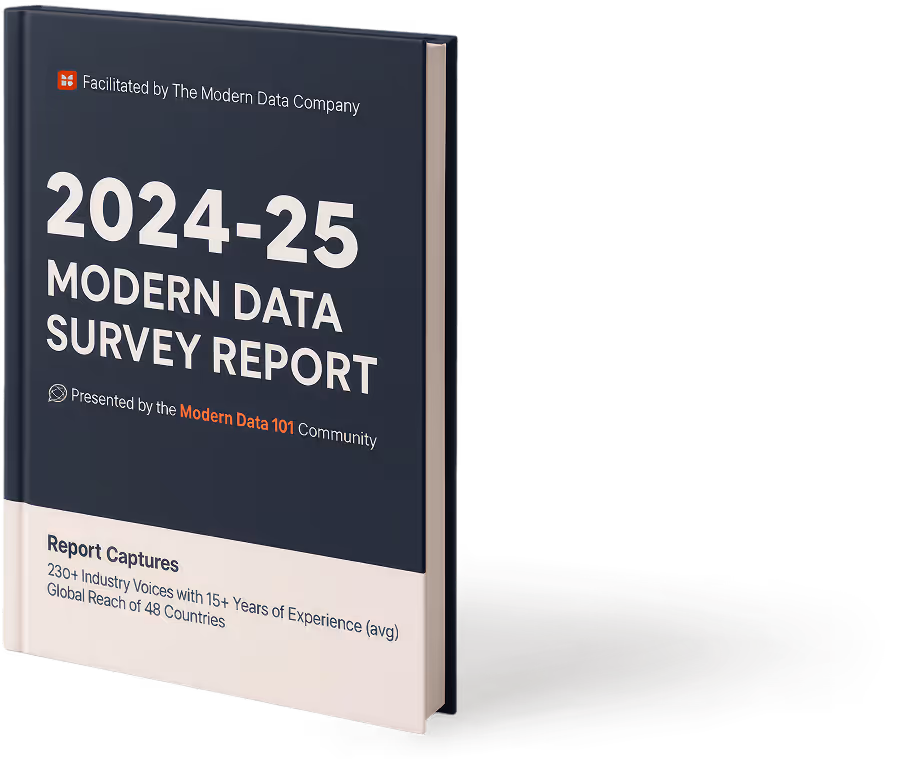
Facilitated by The Modern Data Company in collaboration with the Modern Data 101 Community
Latest reads...

.png)


TABLE OF CONTENT


.jpeg)

Poor data quality costs businesses an average of $12.9 million annually, and 59% of organisations don't even measure it. Whether it's inaccurate customer records, duplicate entries, or stale inventory data, bad data silently erodes decision-making, compliance, and business performance.
Addressing the problems of bad data requires a framework to define and measure it, which in this case is the set of data quality dimensions. These are a set of measurable characteristics that determine whether your data is fit for use.
More importantly, the data quality dimensions do not exist in isolation. They are enabled or compromised by how your data platform is designed.
This article will navigate through the top 10 data quality dimensions and how a unified data platform helps achieve them through its architectural capabilities.
Data quality refers to how well data is fit for its intended use.
It defines the degree to which data is accurate, complete, consistent, timely, and reliable enough to support confident decision-making, business operations, and compliance, without requiring manual correction or second-guessing.
A simple way to think about it is this: data quality answers the question, “Can I trust this data to do the job I need it to do?”
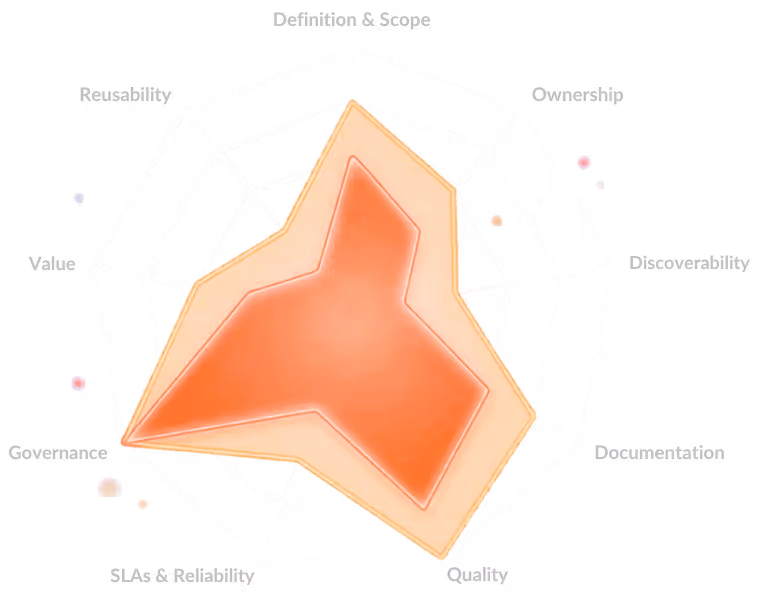
Data quality dimensions are the measurable characteristics used to evaluate whether data is fit for its intended use.
Instead of treating “quality” as a vague concept, these dimensions break it down into specific, observable aspects, enabling teams to assess, monitor, and improve data systematically.

A matrix linking business problems like failed campaigns and inflated revenue to data quality dimensions such as accuracy, completeness, and consistency
The following are the 10 vital data quality dimensions:
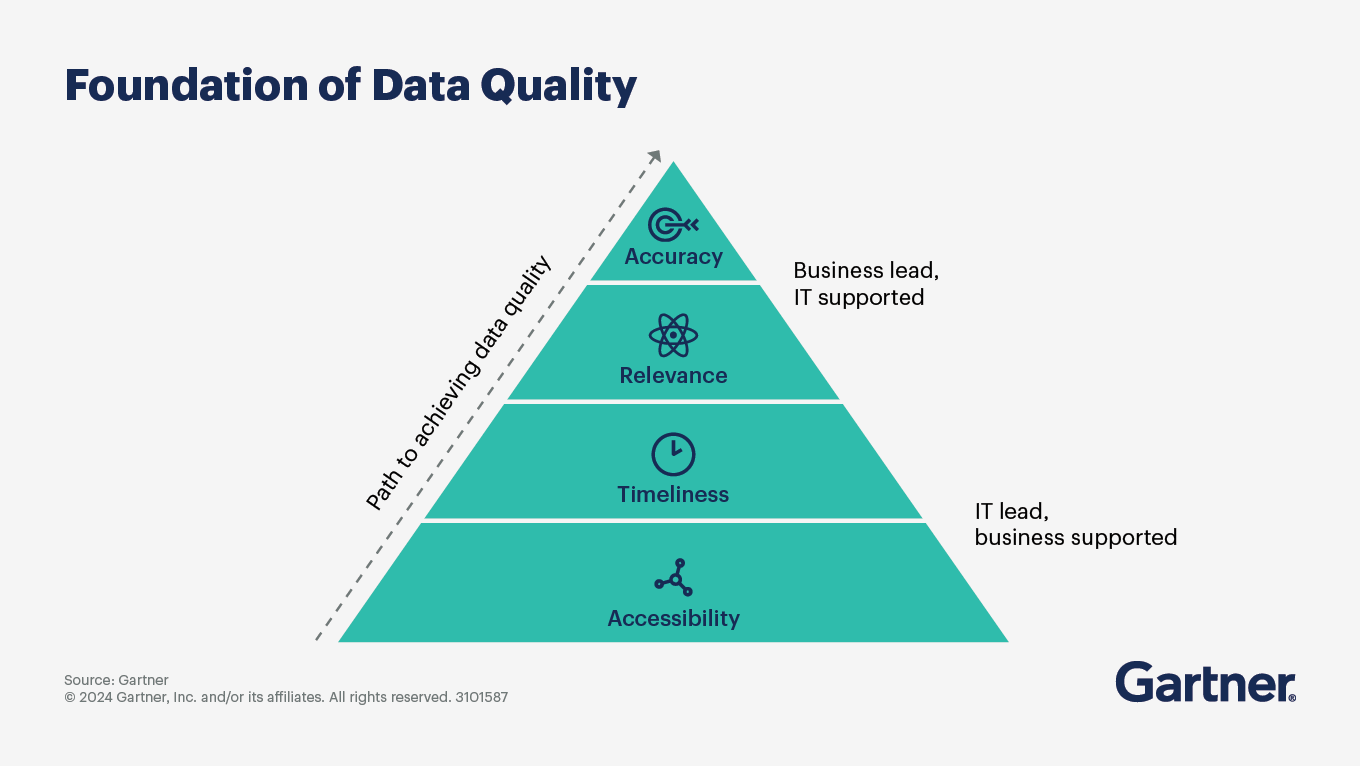
Accuracy measures how closely data reflects real-world entities or events. Inaccurate customer addresses, wrong product codes, or incorrect financial figures lead directly to failed campaigns, audit failures, and poor decisions.
For instance, if a customer’s transaction amount is recorded as ₹10,000 instead of ₹1,000, financial reports and fraud detection systems will produce incorrect outcomes.
Completeness measures whether all required data fields and records are present. Missing data creates gaps in analysis, reduces model performance, and limits decision-making.
An example: A customer dataset without email or phone number fields makes it impossible to run marketing campaigns or send notifications.
Consistency ensures data is uniform across different systems. Inconsistent data leads to conflicting reports and loss of trust in data systems.
For example, if a customer’s status is marked as “Active” in one system and “Inactive” in another, teams will make contradictory decisions.
Outdated data results in delayed or irrelevant insights, especially in real-time decision environments. Timeliness refers to how up-to-date and available data is when needed.
For instance, a fraud detection system using data that is 24 hours old may fail to detect suspicious transactions in time.
For most organisations, invalid data disrupts processing, analytics, and downstream applications. Validity checks whether data conforms to defined formats, types, and business rules.
Example: If a date field contains text like “ABC” instead of a valid date format, systems relying on that field will fail.
Across orgs, duplicate records distort metrics, inflate counts, and create confusion in reporting. Uniqueness ensures that each entity is represented only once, without duplicates.
Example: If a customer appears twice in a database, revenue calculations and customer counts will be inaccurate.
Broken relationships lead to incorrect joins, incomplete data, and unreliable analysis. Integrity ensures that relationships between datasets and entities remain accurate and consistent.
For example, an order record that references a non-existent customer ID breaks referential integrity and impacts reporting.
Reliability indicates whether data remains consistent and dependable over time. Unreliable data reduces confidence and forces teams to double-check or avoid using it altogether, which makes reliability a crucial data quality dimension to consider.
Example: If a dashboard shows different numbers for the same metric every day without explanation, users lose trust in it.
Relevance measures whether the data is appropriate and useful for a specific use case.
Several organisations face irrelevant data adding noise, increasing processing costs, and thereby deviating from meaningful insights. This makes relevance important to measure.
Example: Including social media activity data in a financial risk model may not add value and can complicate analysis.
Accessibility refers to how easily users can find, access, and use the data. Even high-quality data is ineffective if users cannot discover or access it when needed, making accessibility an important dimension for data quality.
Example:
A well-maintained dataset stored in a restricted system without proper access controls or documentation remains underutilised.
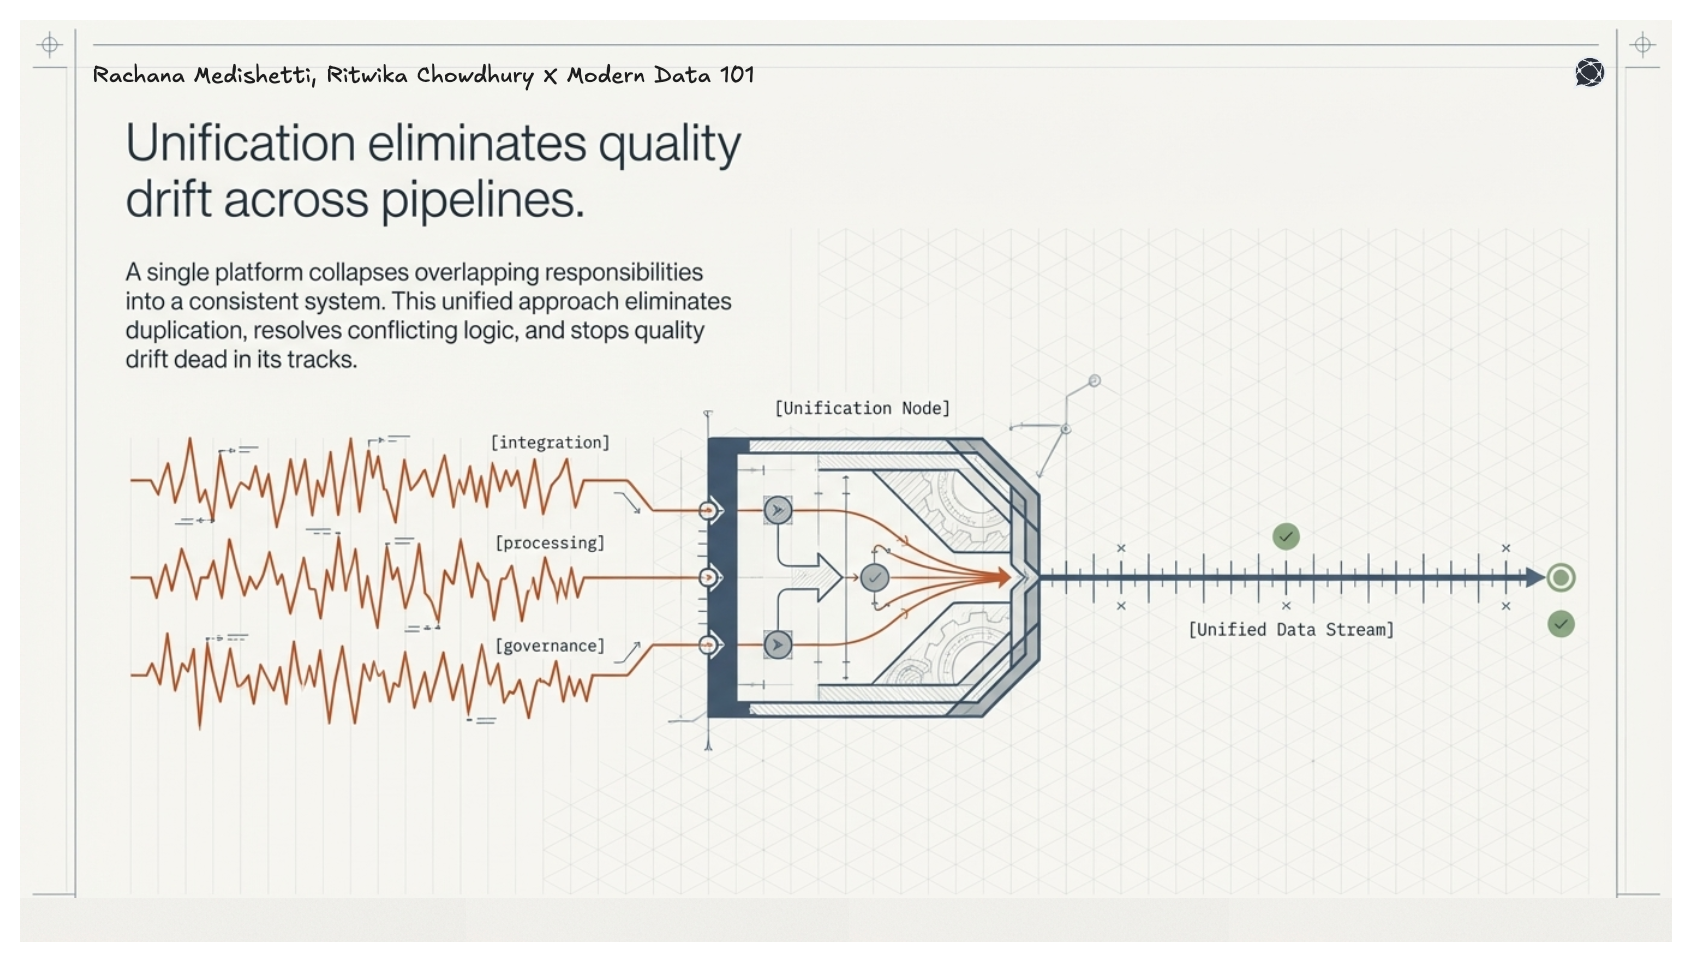
The core problem with assembling point tools includes one for cataloging, one for governance, and one for observability, which is that each brings its own philosophy, semantics, and overlapping capabilities. Over time, this creates duplicate systems, technical debt, and data teams too busy fighting fires to focus on actual data.
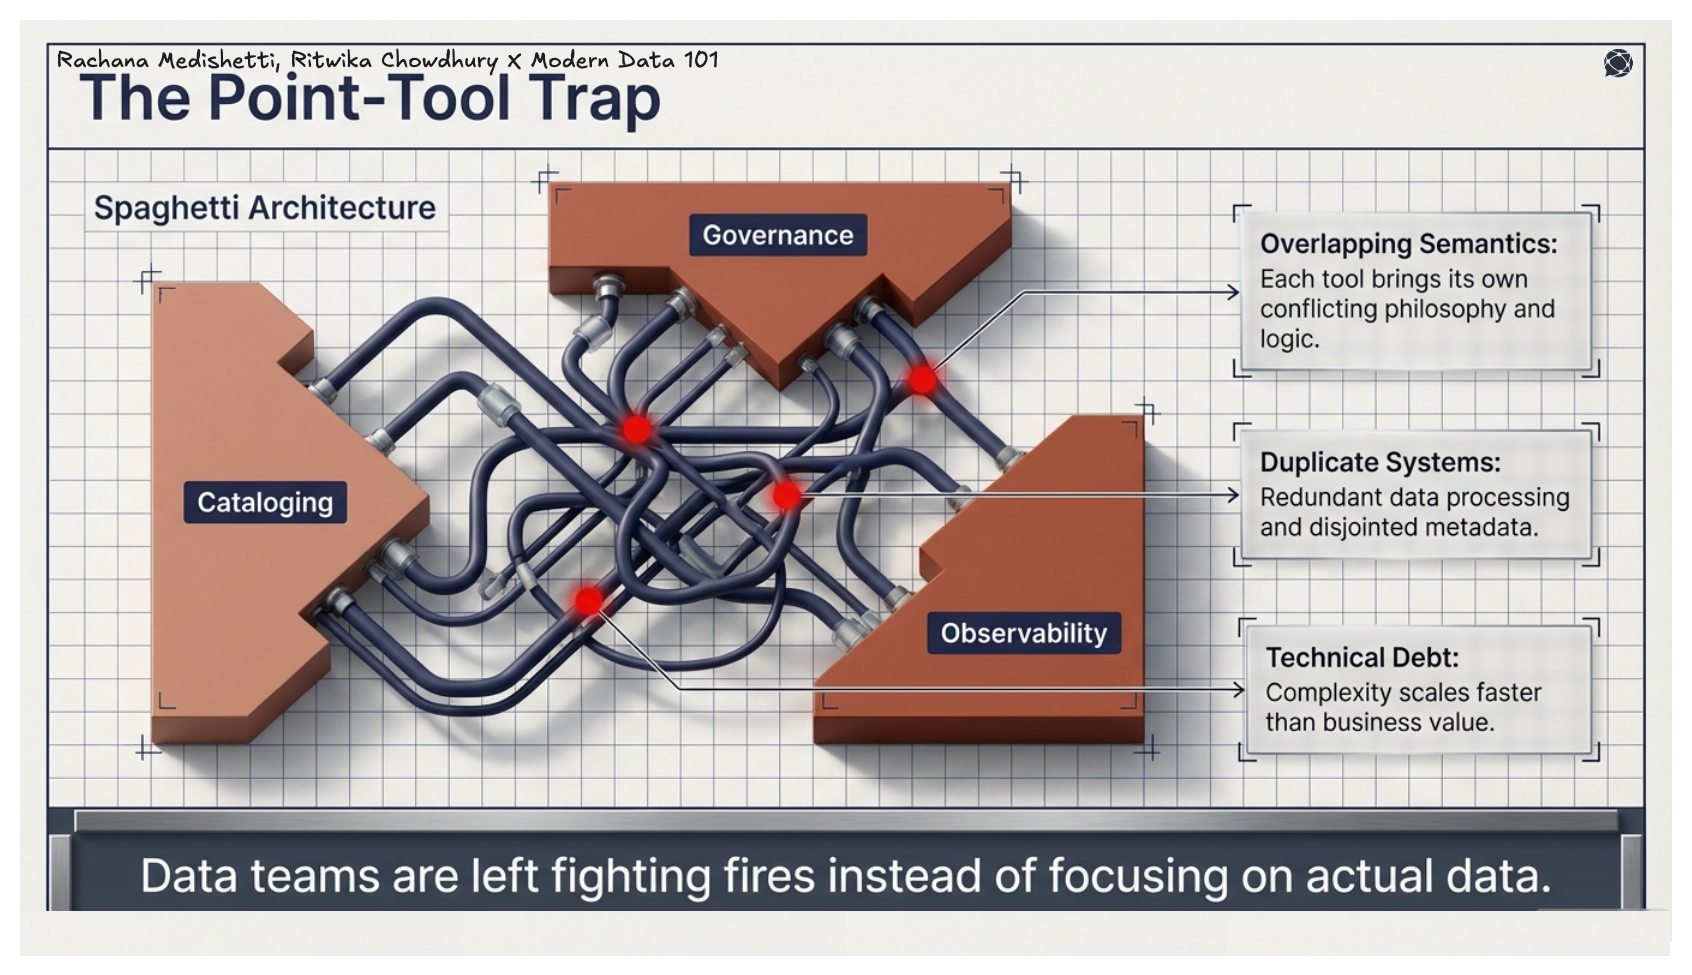
Unified data platforms collapse these conflicting capabilities into a single, composable infrastructure. Platforms built with principles of decentralisation, modularity, with effective unification of the relevant building blocks engineer data quality into the system by design. The architecture and its different capabilities, along with the byproducts of such platforms, are used responsibly to help organisations achieve their target data quality dimensions.
Quality, governance, lineage, and access management are embedded as first-class capabilities, and not bolted on as afterthoughts. The result: data that is discoverable, trustworthy, interoperable, and aligned with the quality requirements of every consumer. Hence, measuring and managing the data quality dimensions becomes more sustainable.
Let’s explore the different features of these converged data platforms and how they enable the DQ dimensions.


Data quality has traditionally been treated as a reactive discipline, measured after pipelines break, corrected after trust is lost, and governed through fragmented tools and processes. But as the scale, speed, and stakes of data grow, this approach no longer holds.
The shift is clear: data quality is an element to design for.
The dimensions outlined above provide the language to define what “good” looks like. But it is the platform that determines whether those dimensions are consistently achieved or constantly violated. When data systems are fragmented, quality becomes an ongoing struggle. When they are unified, quality becomes a natural outcome.
This is where unified data platforms, like data developer platforms, fundamentally change the equation. By embedding quality, governance, and observability into the architecture itself, they move organisations from chasing issues to preventing them.
The result is not just cleaner data, but trusted data that flows seamlessly across the organisation, powering decisions, operations, and AI with confidence.
Ans: A data quality framework is a structured approach that defines how an organisation measures, monitors, and improves data quality.
It typically includes dimensions, rules & standards, processes & ownership, and monitoring & remediation mechanisms.
Data quality dimensions matter because they make “good data” measurable and actionable. These provide a clear way to define, assess, and improve data by breaking quality into specific attributes like accuracy, completeness, and timeliness. Without them, data quality remains subjective and inconsistent.
Data quality dimensions are measured using defined rules, metrics, and continuous monitoring.
Each dimension is translated into quantifiable checks, such as:
These metrics are tracked through unified data platforms effectively, eliminating the need for separate automated validation, data profiling, and observability tools.
Your Copy of the Modern Data Survey Report
Better decisions start with shared insight.
Pass it along to your team →
Your Copy of the Modern Data Survey Report
Better decisions start with shared insight.
Pass it along to your team →


Find more community resources
Modern Data 101 is a movement redefining how the world thinks about data. A community built by the same team behind the world’s first data operating system, Modern Data 101 sits at the intersection of data, product thinking, and AI. Spread across 150+ countries, the community brings together a global network of practitioners, architects, and leaders who are actively building the next generation of data systems.
At its core, Modern Data 101 exists to simplify the journey from raw data to tangible and observable impact. It advocates high-potential data systems and next-gen architectures to unify and activate insights and automation across analytics, applications, and operational workflows at the edge.
In a world shifting from data stacks to AI ecosystems, Modern Data 101 helps teams not just navigate the change but lead it.

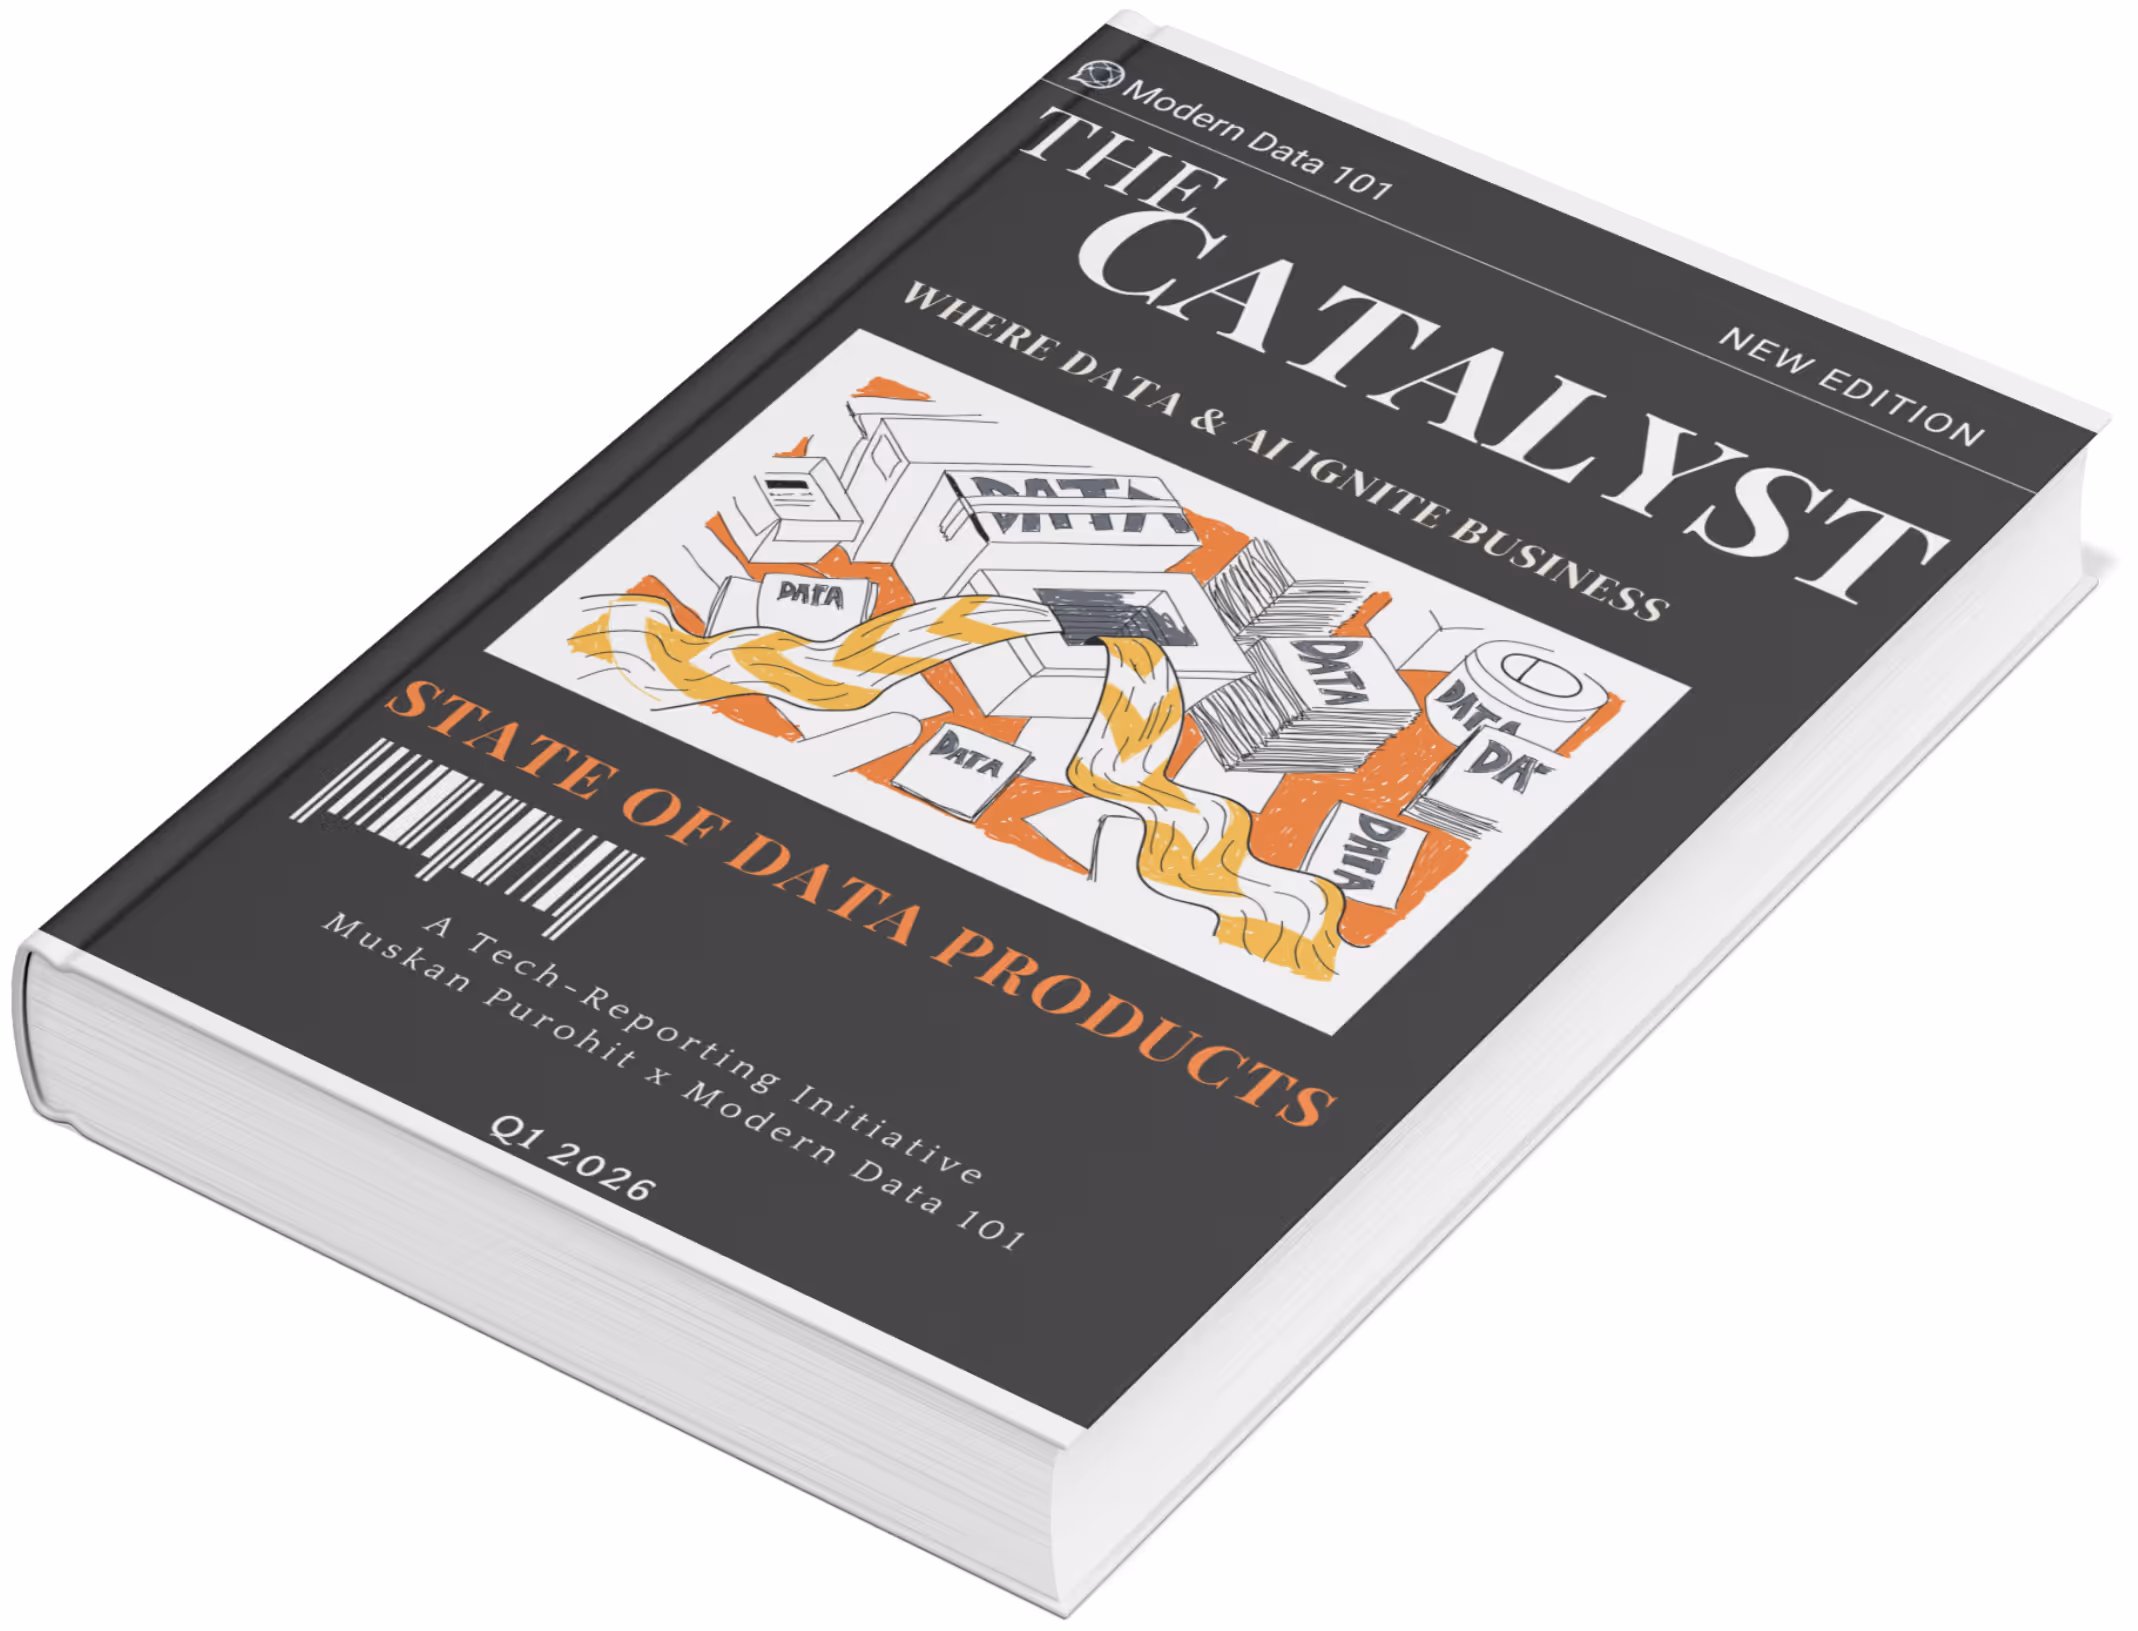
Find all things data products, be it strategy, implementation, or a directory of top data product experts & their insights to learn from.
Connect with the minds shaping the future of data. Modern Data 101 is your gateway to share ideas and build relationships that drive innovation.
Showcase your expertise and stand out in a community of like-minded professionals. Share your journey, insights, and solutions with peers and industry leaders.

