


Access full report
Oops! Something went wrong while submitting the form.

🤍

Facilitated by The Modern Data Company in collaboration with the Modern Data 101 Community
Latest reads...

%20(1).png)

.png)
TABLE OF CONTENT


Did we all think once that data analysis is about generating visuals? We might have, but analysis at the core is about problem-solving and decision-making. If analysts don’t develop a problem-solving mindset and understand the business context, all the dashboards in the world won’t drive impactful decisions.
Solving problems means understanding stakeholder needs, asking proactive questions, forming hypotheses, and adapting insights into action, rather than simply knocking out dashboards.
A 2024 dbt Labs survey of 456 data practitioners found that over 50% spend most of their time organising datasets for analysis, and poor data quality was flagged as a predominant challenge by 57% of professionals, up from 41% in 2022.
Yet most analysts today are trapped in repetitive tasks and disconnected tools. This article will navigate such challenges of data analysts and take a fresh approach to how a data products mindset, particularly when enhanced with AI, frees analysts to focus on strategic problem solving rather than manual production, exactly the shift experts say defines a truly impactful analyst.
[data-expert]
A data analyst is the bridge between raw data and real-world decisions. They turn messy, scattered information into answers that help teams understand what’s happening, why it’s happening, and what to do next.
Their work typically involves querying databases, cleaning and transforming data, building reports and dashboards, and identifying trends or anomalies. They work closely with business teams to understand what questions need answering, and with data engineers to understand what data is available and how it’s structured.
What defines a data analyst is the ability to frame the right question, find the most reliable answer, and communicate it clearly to people who didn’t touch the data themselves.
[related-1]
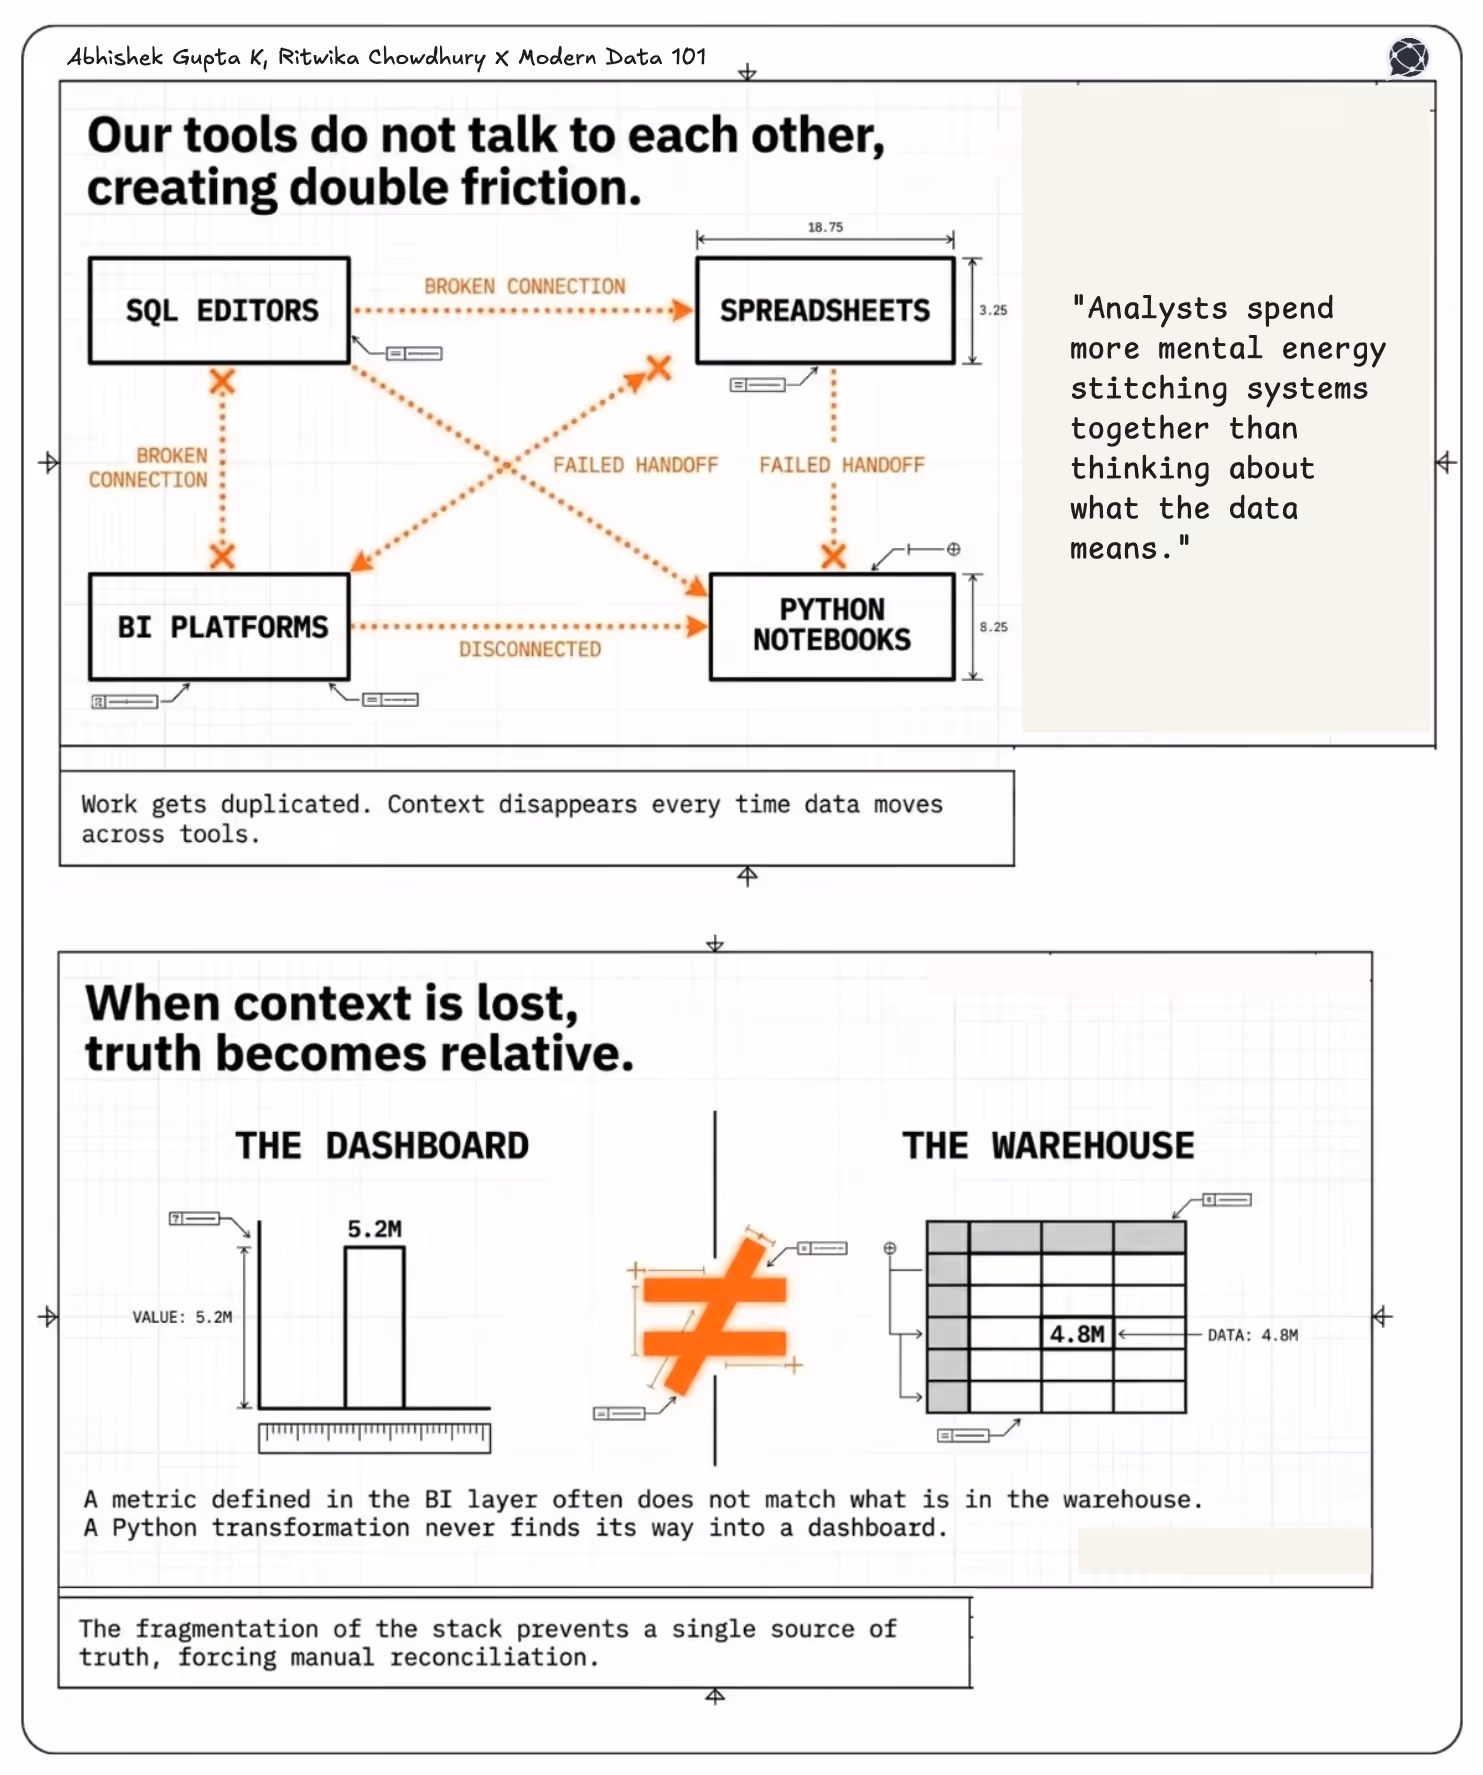
Data analysts are often caught between two worlds: the technical complexity of data systems and the business urgency of decision-making. Much of their time is consumed not by analysis itself, but by the fragile, manual work that surrounds it.
[playbook]
Recent discussions from analytics professionals and practitioners emphasise that the analysts who add real value combine technical fluency with strategic and communicative clarity.
1. Technical Fundamentals Are the Starting Line (Not the Finish)
Almost every analyst begins with the basics. Excel and SQL are the foundational languages of real-world data work, enabling analysts to explore, filter, and join data in ways non-technical tools cannot handle efficiently. These skills become more important than any other trendy tool in the industry.
From there, proficiency with BI platforms like Power BI or Tableau, and familiarity with cloud-based analytics basics, help analysts extract and visualise patterns at scale. But an important distinction is that technical skills help you pull data, while strong analytical thinking helps you connect it to decisions.
2. Analytical Thinking
Skills like Python or SQL are good to have, but won’t distinguish analysts long-term if they can’t interpret what the data means. Analysts who can frame a problem, question assumptions, and translate numbers into actionable narratives are the ones whose work actually impacts decisions.
Focused analytical thought, or the ability to question a dataset, challenge its assumptions, and uncover patterns others overlook, is what elevates a good analyst into a strategic partner in the business.
[related-2]
3. Communication and Storytelling Bridge Data and Action
A dataset is only useful if someone else understands it. Strong analysts tell a coherent story, explaining why trends matter and what actions stakeholders should take.
This enables translating complex insights into accessible language for non-technical audiences, structuring narratives around business outcomes, and engaging stakeholders in decisions rather than overwhelming them with numbers.
4. Curiosity, Context, and Domain Knowledge Win the Long Game
An efficient data analyst asks why before how, immersing themselves in the business context, learn the domain, and connecting data patterns to real-world problems. These qualities were repeatedly highlighted in professional discussions as differentiators between someone who analyses data and someone who drives insight.
Data products create the conditions where analysts can actually use their strengths instead of getting buried under manual work, broken pipelines, or inconsistent definitions.
Here’s how data products turn analyst strengths into business value:
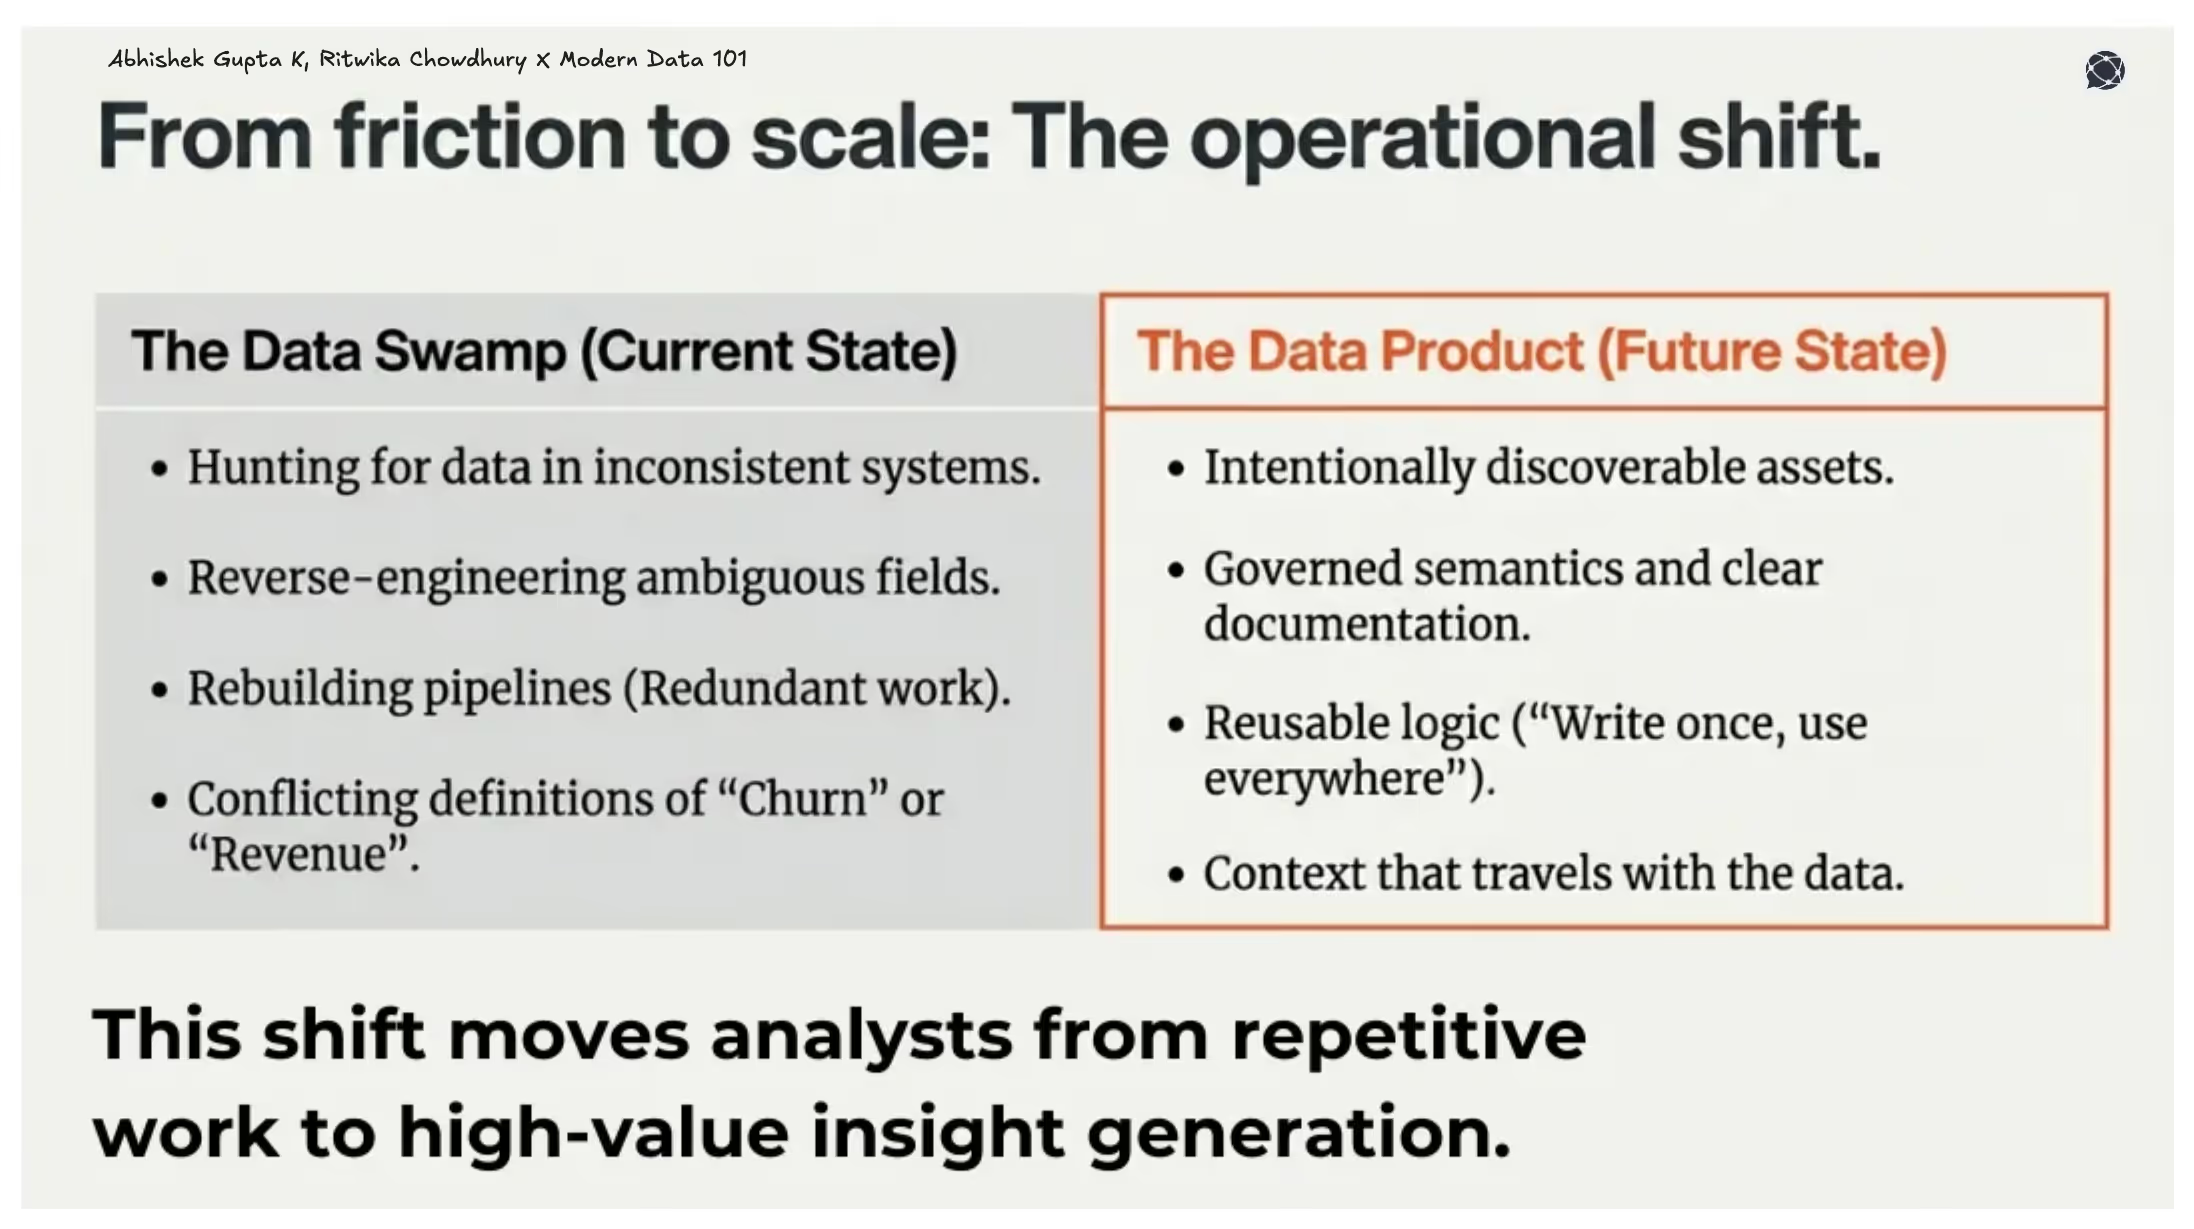
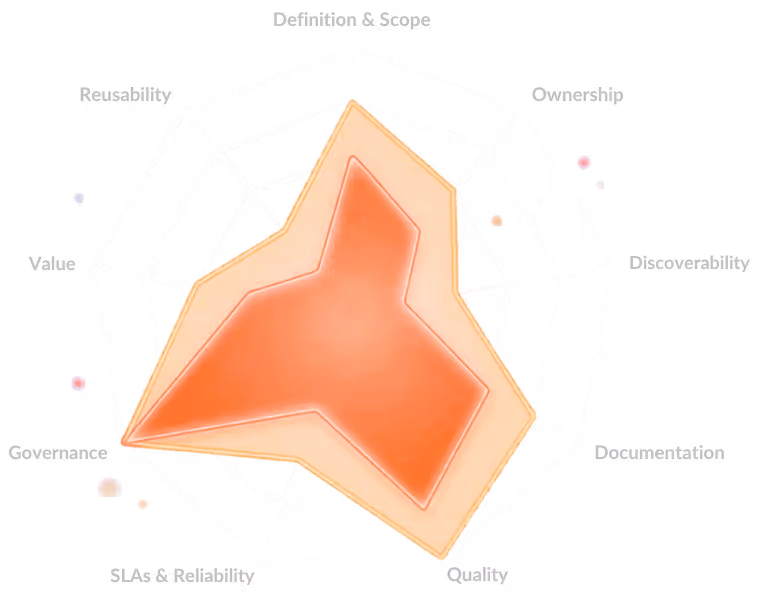
Data products are intentionally discoverable, meaning analysts can quickly find the exact data assets they need without searching across dozens of inconsistent tables, systems, or undocumented datasets.
This reduces time wasted hunting for information and increases confidence that they are using the right data for the task.
Data products are understandable, providing necessary documentation, metadata, semantics, and explanations.
Analysts benefit because they don’t need to reverse-engineer ambiguous fields. They are enabled to interpret metrics in a consistent, governed way and avoid conflicting definitions (e.g., “active users,” “revenue,” “churn”).
This dramatically reduces misunderstandings and misalignment in reporting.
Good analysts don’t want to rebuild the same pipeline, metric, or model for the tenth time. Data products capture logic once, such as pipelines, transformations, and definitions, and make it reusable everywhere. Hence, analysts stop reinventing. Teams stop fragmenting. Output gets faster and more accurate.
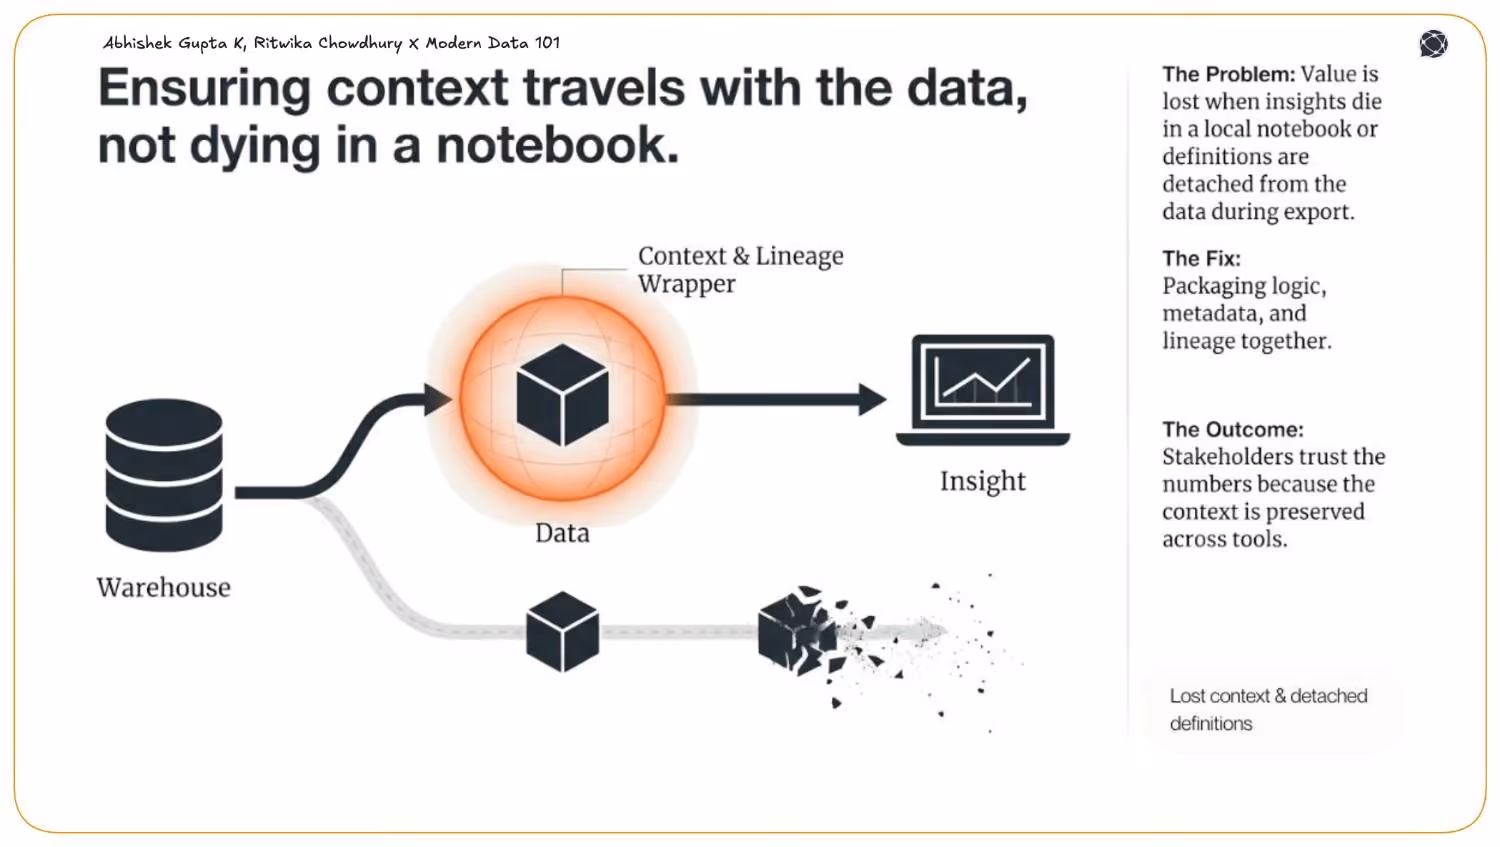
Analysts lose enormous value when insights die in a notebook or definitions get lost across tools. Data products package logic, metadata, lineage, and documentation together, so context travels with the data.
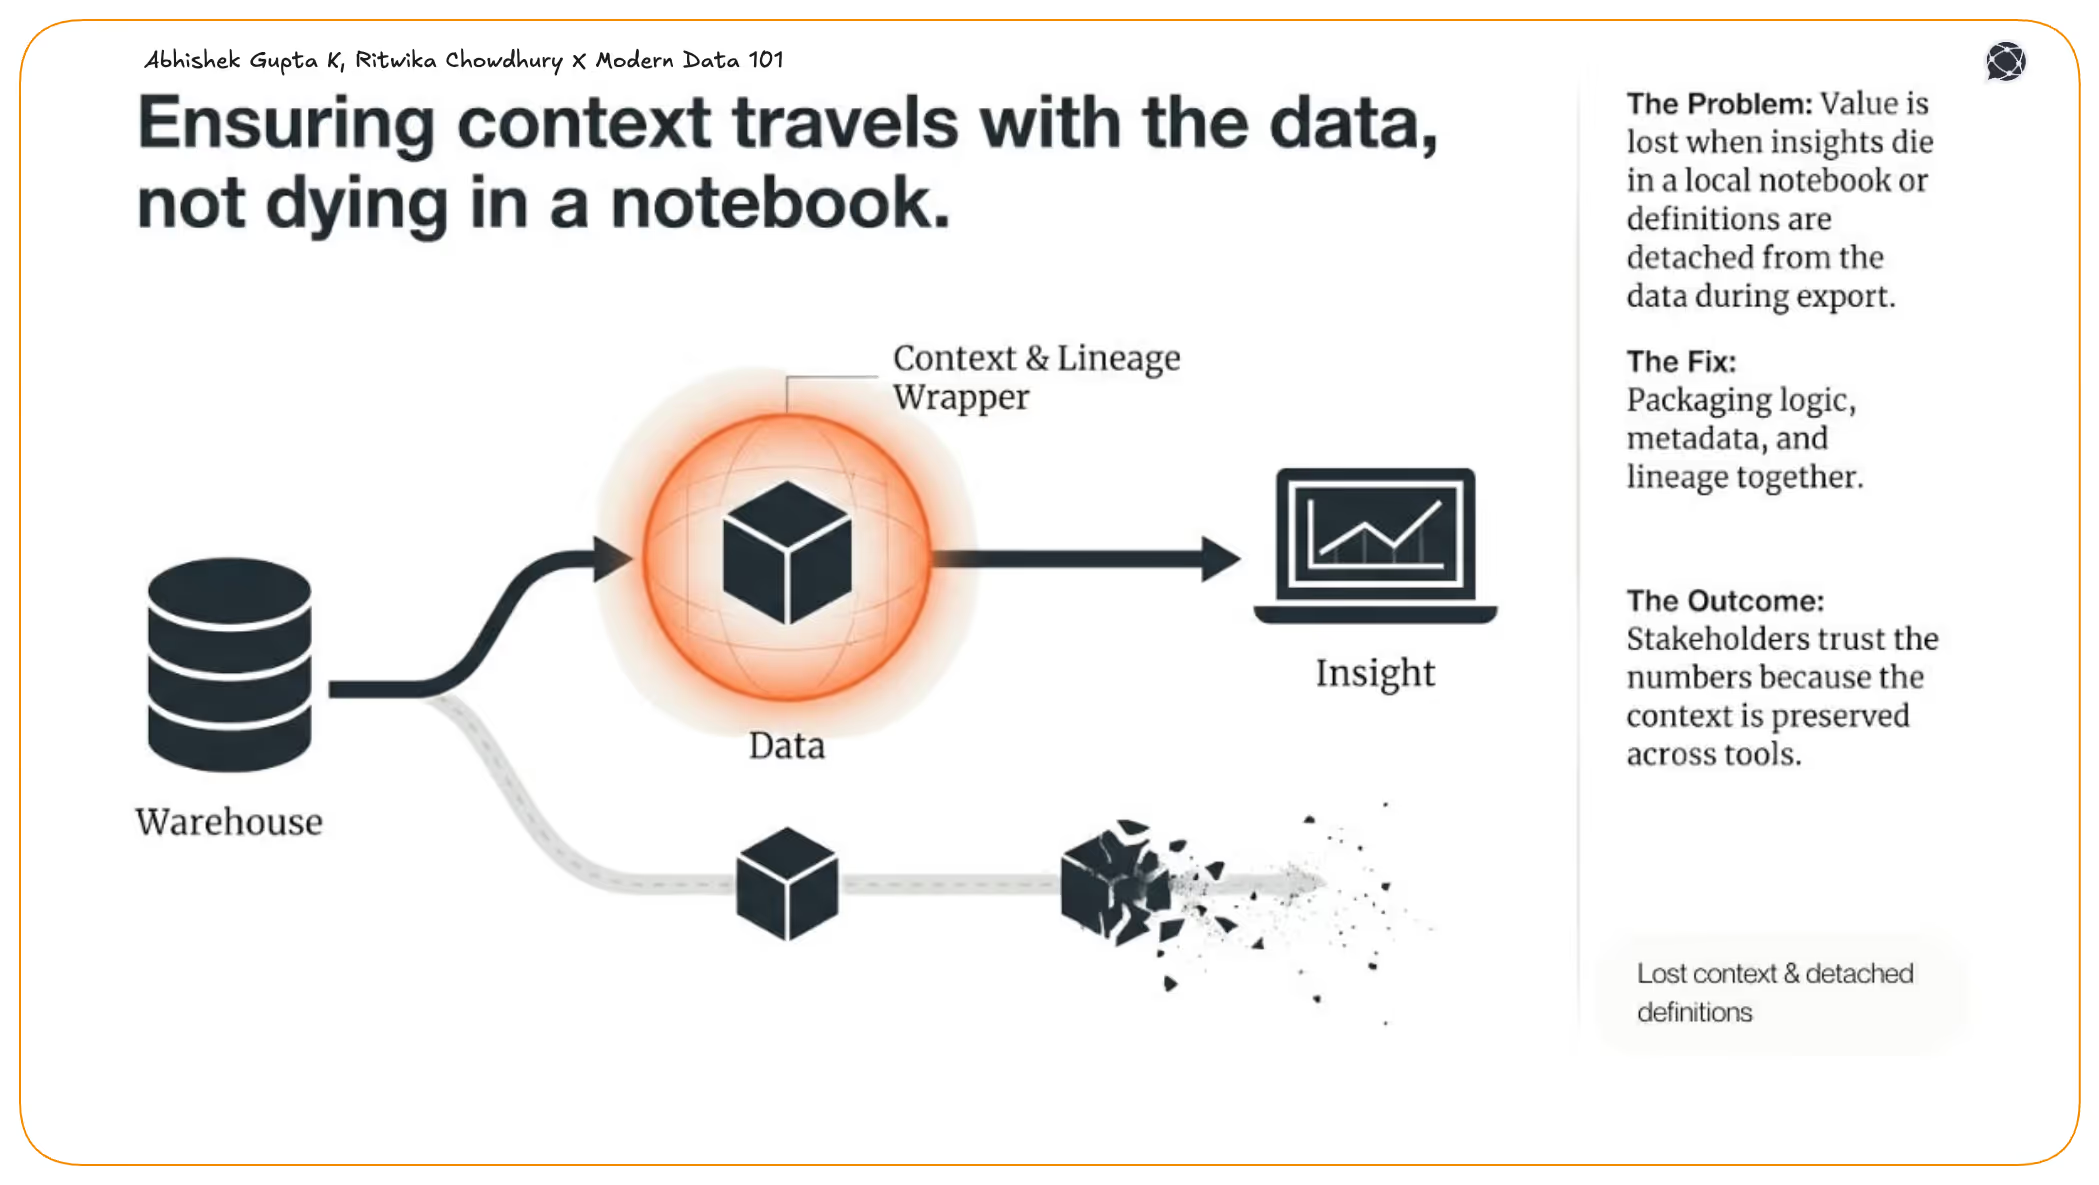
Therefore, everyone speaks the same analytical language, and stakeholders finally trust the numbers.
Because data products are designed to be interoperable and independent, analysts get data that behaves consistently across domains and systems.
This consistency helps analysts combine datasets without constant rework, build scalable dashboards and analyses & trust that upstream changes will be managed and communicated, leading to more reliable cross-functional insights.
By adopting a product mindset for data, organisations hold people accountable for the payoff of data investments over time, treating both data assets and data solutions as valuable offerings with a lifecycle, including market development, customer appeal, deployment, continuous improvement, and retirement.
The data-as-a-product mindset treats data users as customers, developing data products to help them achieve their end goals. If a customer’s goal is to reduce churn by 10%, the team starts with that goal and works backwards, developing a product that meets that specific need. Thinking of data as a product means putting user needs at the heart of design.
Hence, a well-equipped analytics team is a necessary condition of using data to drive business value, but it’s not a sufficient one. To more actively contribute to critical business outcomes, analytics teams should start viewing their work through a product development lens. As we look at data with a product development fundamental, in terms of planning and execution, it allows organisations to scale isolated successes into sustained, organisation-wide, data-driven decision-making.
Most data analysts build their foundation in statistics, mathematics, or a related field, then develop proficiency in SQL for querying data, a programming language like Python or R for analysis, and a BI tool like Tableau or Power BI for visualisation. Practical experience through projects or internships matters as much as formal education, and certifications from Google, IBM, or Coursera can help bridge the gap for career switchers.
A data analyst answers defined business questions using existing data. Their work is largely descriptive and diagnostic, focused on what happened and why. A data scientist goes further, building predictive models and machine learning systems to forecast what will happen or to uncover patterns that aren’t yet visible. Analysts work closer to the business; data scientists work closer to the algorithm. In practice, the line blurs, but the key
Data analysts work across four broad areas: data, tools, people, and problems.
On the data side, they work with structured data from databases, spreadsheets, and data warehouses; cleaning it, transforming it, and making it analysis-ready. On the tools side, they rely on SQL to query data, Python or R to manipulate and analyse it, and BI platforms like Tableau or Power BI to visualise and communicate findings.
But analysts don’t just work with data and tools; they work closely with stakeholders across business functions to understand what questions need answering and with data engineers to understand how data is structured and where it lives. At the centre of it all is the problem itself: a business question that needs a reliable, data-backed answer.
Your Copy of the Modern Data Survey Report
Better decisions start with shared insight.
Pass it along to your team →
Your Copy of the Modern Data Survey Report
Better decisions start with shared insight.
Pass it along to your team →


Find more community resources
Modern Data 101 is a movement redefining how the world thinks about data. A community built by the same team behind the world’s first data operating system, Modern Data 101 sits at the intersection of data, product thinking, and AI. Spread across 150+ countries, the community brings together a global network of practitioners, architects, and leaders who are actively building the next generation of data systems.
At its core, Modern Data 101 exists to simplify the journey from raw data to tangible and observable impact. It advocates high-potential data systems and next-gen architectures to unify and activate insights and automation across analytics, applications, and operational workflows at the edge.
In a world shifting from data stacks to AI ecosystems, Modern Data 101 helps teams not just navigate the change but lead it.

Find all things data products, be it strategy, implementation, or a directory of top data product experts & their insights to learn from.
Connect with the minds shaping the future of data. Modern Data 101 is your gateway to share ideas and build relationships that drive innovation.
Showcase your expertise and stand out in a community of like-minded professionals. Share your journey, insights, and solutions with peers and industry leaders.


