12 Data Quality Metrics to Track in 2027: From Pipelines to AI Readiness
The essential data quality metrics to track in 2027, from pipeline reliability to AI readiness, and how to measure data fitness for trustworthy decisions.

Data quality used to be an analytics problem. A wrong number in a dashboard got caught by an analyst who knew the business well enough to spot it. In 2027, more data is consumed by AI models and agents that act on whatever they receive.
That raises the stakes. In the Modern Data Report 2026, almost 70% of respondents said their data isn’t clean or trustworthy enough for AI. Closing that gap starts with measuring it.
What Is Data Quality?
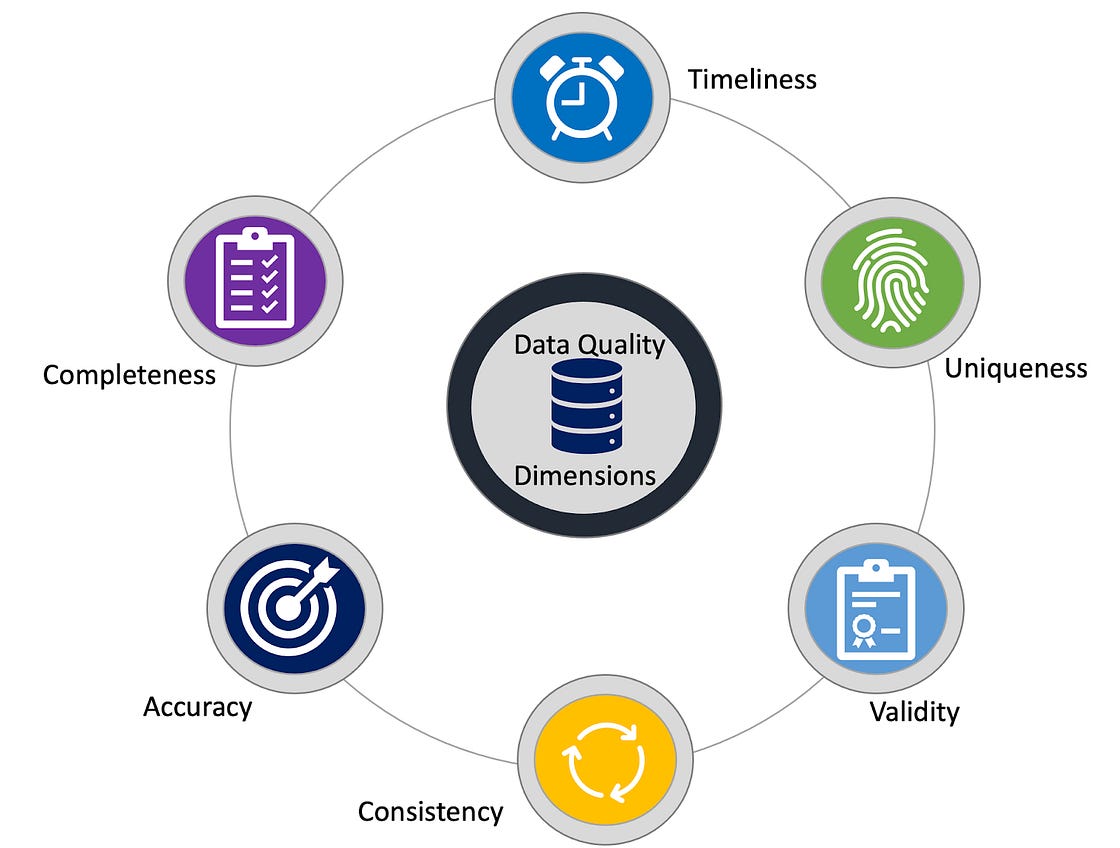
Data quality is the degree to which data is fit for its intended use. High-quality data is accurate, complete, consistent, timely, valid, and unique, and it can be trusted by whoever or whatever consumes it.
[related-2]
“Fit for use” is the key phrase. The same dataset can be good enough for a monthly trend report and too slow for a real-time fraud model.
Data Quality Dimensions vs. Metrics vs. Measures
- Dimensions are the properties data should have, such as accuracy or completeness.
- Metrics turn a dimension into a number you can track, such as the percentage of non-null values in a column.
- Measures are the checks, rules, and thresholds that produce and evaluate those numbers, such as a rule that flags completeness below 98%.
12 Data Quality Metrics to Track in 2027
The top 12 metrics below fall into three groups:
- Core data metrics (1 to 6): the classic dimensions.
- Pipeline reliability metrics (7 to 10): whether data arrives intact and on time.
- Trust metrics (11 and 12): whether data can be understood and relied on by people and AI.
Core data metrics
1. Completeness
Completeness tracks the share of required fields and records that are actually populated. Gaps usually come from optional form fields, failed integrations, or source systems that changed what they collect.
Missing values break joins, skew averages, and leave models learning from a partial picture. Measure completeness on critical fields, such as identifiers and values used in calculations, rather than every column.
2. Accuracy
Accuracy tracks how closely data reflects the real-world entity or event it describes. It is the dimension business users care about most and the hardest to measure, because it needs a trusted reference: a system of record, a reconciled ledger, or a sample checked by hand.
Inaccurate data is dangerous because it looks normal. A wrong address or price passes every format check and still breaks billing, delivery, or a model’s predictions.
3. Validity
Validity tracks whether values follow the rules they should. That covers format rules, like a properly structured email or date, and business rules, like a delivery date that can’t come before its order date.
Invalid values often fail silently downstream. Define validity rules with the teams who use the data, since those rules capture business knowledge that engineers may not have.
4. Consistency
Consistency tracks whether the same fact matches across systems and over time. When the CRM and the warehouse show different revenue for one customer, every report built on them inherits the conflict.
Inconsistency usually traces back to sync delays, separate teams maintaining their own copies, or the same term defined differently in different places. Fixing the definitions often matters more than fixing the data.
5. Uniqueness
Uniqueness tracks whether each real-world entity appears only once. Duplicates come from repeated ingestion, merged systems, and records entered with slight variations.
They inflate counts and revenue, waste outreach on the same customer twice, and multiply rows in joins. Primary keys should have no duplicates; customer and product records usually need matching logic to catch near-duplicates.
6. Freshness
Freshness tracks how recently data was updated compared with how recently it should have been. Accurate data that arrives late can still lead to wrong decisions.
Set freshness expectations by use case: a live operations dashboard may need minutes, a weekly report can tolerate a day. For AI agents acting in real time, freshness becomes one of the most important metrics on this list.
Pipeline Reliability Metrics
7. Schema Stability
Schema stability tracks unplanned changes to a dataset’s structure, such as columns being added, dropped, renamed, or retyped. A renamed upstream column rarely causes an error; it quietly turns downstream values into nulls.
Monitoring schema changes catches the cause of many quality issues before completeness or accuracy checks catch the symptoms.
8. Volume
Volume tracks whether each load delivers the expected amount of data, compared against its normal range. A sudden drop often signals a partial or failed load; a sudden spike often signals duplicated ingestion.
Volume issues can pass every column-level check, which is why they need their own metric.
9. Data Downtime
Data downtime, a concept popularised by Monte Carlo, tracks how long data is missing, wrong, or unusable. It combines three signals: how often incidents happen, how long they take to detect, and how long they take to resolve.
It gives leadership one number for data reliability. Reducing detection time usually has the biggest payoff, since it shortens every incident.
[related-1]
10. Monitoring Coverage
Monitoring coverage tracks the share of production datasets with automated quality checks in place. Every other metric only reports on what is monitored, so low coverage means problems surface only when a consumer complains.
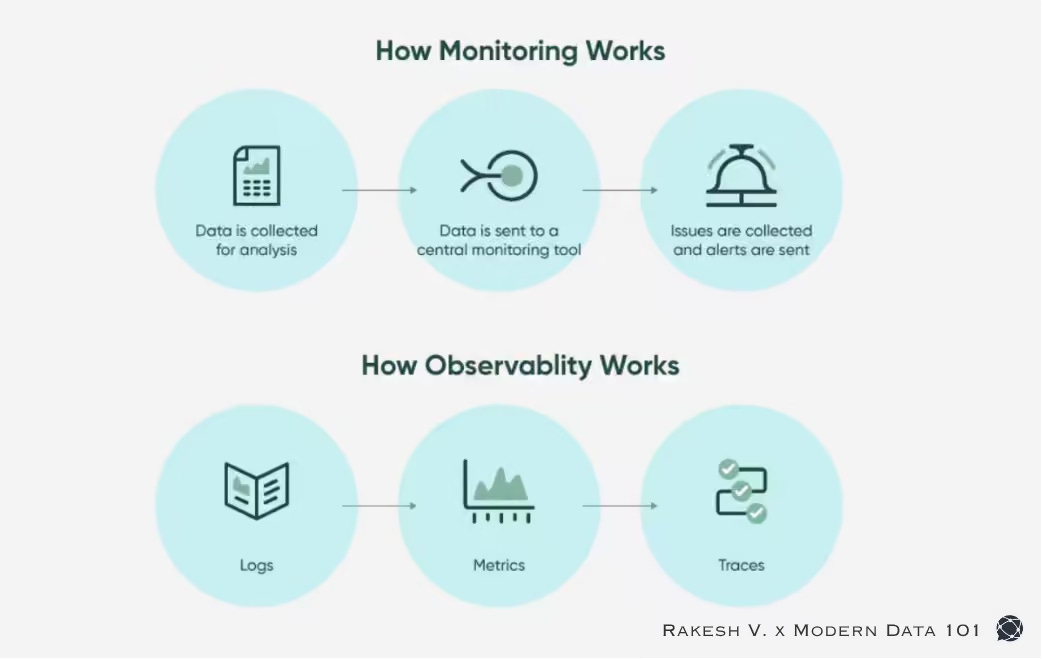
Start with full coverage on the datasets that feed critical decisions and AI use cases, then expand.
Trust and AI-Readiness Metrics
11. Metadata and Lineage Completeness
This metric tracks the share of datasets that carry the context needed to use them correctly: a named owner, a description, business definitions for key fields, and lineage showing where the data came from.
Clean data without context still gets misused. An analyst can ask a colleague what “active customer” means; an AI agent can’t. In the same Modern Data Report, 65% of respondents said their data lacks the business context AI needs. Read more in AI-Ready Data vs. Analytics-Ready Data.
12. Data Quality Score
A data quality score rolls the metrics above into a single trust rating for each dataset or data product, weighted by what matters for its use. A finance dataset might weight accuracy heavily; an operational dataset might weight freshness.
Publishing the score alongside each data product lets consumers, human or AI, judge whether the data is fit for their purpose before they use it.
How to Choose and Apply Data Quality Metrics
When implementing a data quality framework, start small:
- Pick High-Impact Use Cases: Select the core datasets powering your most critical decisions, dashboards, or AI applications.
- Instrument Core Metrics First: Apply completeness, validity, uniqueness, and freshness checks at the point of ingestion.
- Layer on Reliability Metrics: Add schema stability, volume tracking, and data downtime monitoring.
- Establish Context & Trust: Add metadata completeness checks and composite quality scores to your guide to data products.
To evaluate technical platforms that automate these governance checks, explore our analysis of the top data platforms for 2026.
[playbook]
FAQs
Q1. What is data quality?
Data quality is how well data serves its intended purpose, judged across dimensions such as accuracy, completeness, consistency, timeliness, validity, and uniqueness.
Q2. What are data quality metrics?
They are quantifiable measurements of those dimensions, such as completeness rate or duplicate rate, tracked over time.
Q3. What is the difference between data quality metrics and measures?
Metrics are the numbers you track. Measures are the checks and thresholds that produce them and decide when they need attention.
Q4. Which data quality metric matters most for AI?
Freshness, accuracy, and metadata completeness, because AI acts on data immediately and can’t interpret missing context.
Connect with a community data expert
A no-cost session with a practitioner who's been where you are.
About Modern Data 101
Modern Data 101 is a movement redefining how the world thinks about data. A community built by the same team behind the world’s first data operating system, Modern Data 101 sits at the intersection of data, product thinking, and AI. Spread across 150+ countries, the community brings together a global network of practitioners, architects, and leaders who are actively building the next generation of data systems.
At its core, Modern Data 101 exists to simplify the journey from raw data to tangible and observable impact. It advocates high-potential data systems and next-gen architectures to unify and activate insights and automation across analytics, applications, and operational workflows at the edge.
In a world shifting from data stacks to AI ecosystems, Modern Data 101 helps teams not just navigate the change but lead it.


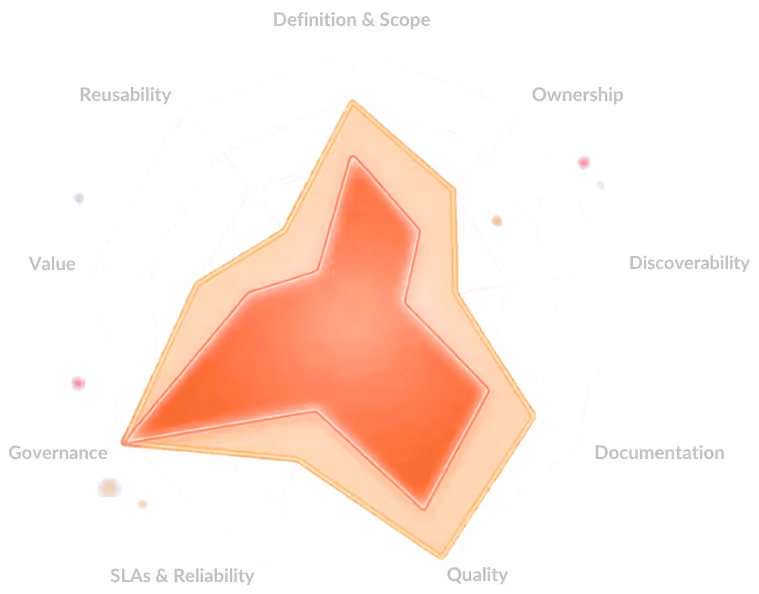
A 9-dimension self-assessment used by 100+ data teams to benchmark strategy, ownership, and platform readiness.


Ritwika Chowdhury
Ritwika Chowdhury is a data and technology professional focused on data products, AI, and modern data architecture. Her work sits at the intersection of data strategy, product thinking, and emerging AI technologies, with a focus on helping organisations turn enterprise data into trusted, usable, and scalable assets.
Read the ideas here. Build them with The Modern Data Company.
Modern Data 101 is where the data community thinks out loud. When you're ready to move from articles to architecture, data products, governed AI pipelines, or a full Data Operating System; the team behind this community can help you build it.
Continue reading