Traditional Monitoring vs. AI Observability: What's Best for Fixing Broken AI
Why a passing dashboard doesn't mean a passing model, and what it actually takes to diagnose AI systems that fail silently.

The Green Light Paradox: When Healthy Infrastructure Hides AI Failure
Your dashboards are beaming in green. CPU usage is nominal, latency is well within its threshold, uptime is 99.99%, and the on-call engineer hasn’t been called in days. The system looks perfectly healthy, and yet the AI model at the center of all this has been returning wrong answers for two weeks.
The reason? Monitoring only tracks system health, not data meaning.
💡Think of this: Your vitals seem completely normal, and still you don’t feel healthy. The reason can be an underlying problem that hasn’t been diagnosed yet. A detailed full-body diagnosis might reveal the issue causing you the trouble.
This is the classical paradox at the heart of modern AI operations. The metrics that once guaranteed system health no longer guarantee model health. As Twilio notes, an AI agent can return a response in milliseconds, throw no errors, and still give a customer wrong information, which standard monitoring won't catch, but observability will. The recommendation engine can cater to every request in under 100 milliseconds while recommending the wrong products.
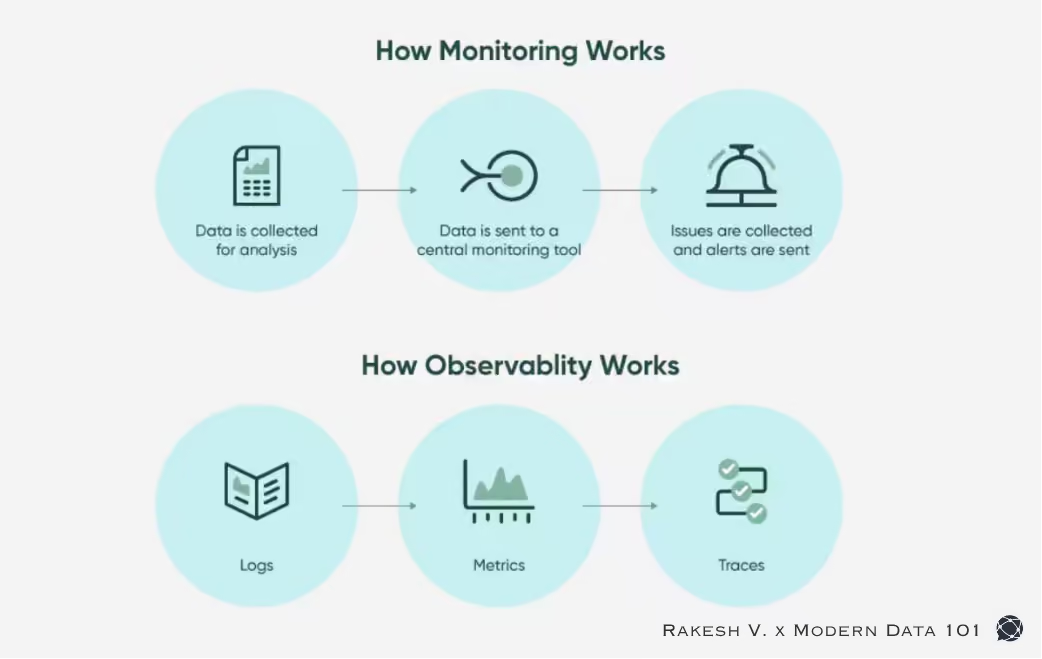
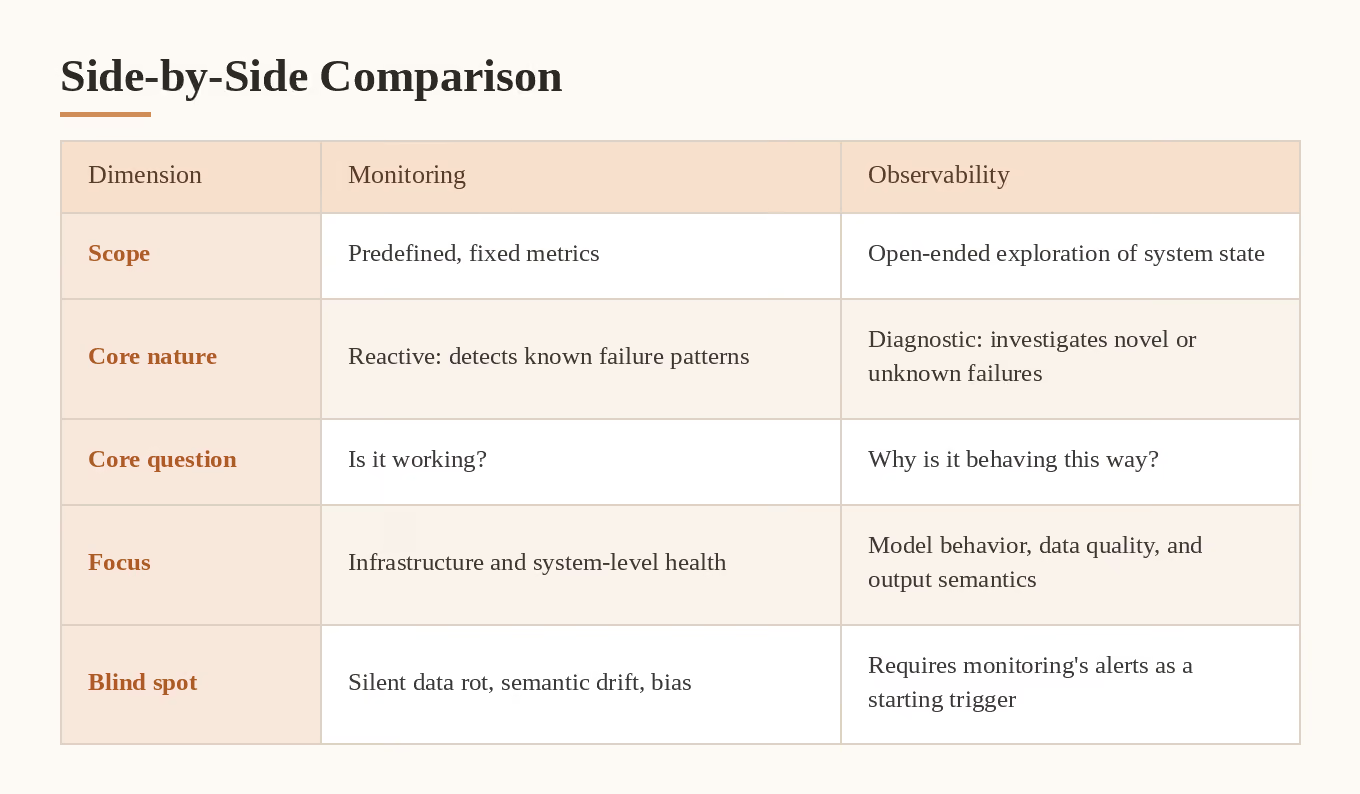
The gap between "system is running" and "system is running correctly" is the exact distinction between monitoring and observability. The baseline is simple: monitoring alerts you that something is broken in the system, while observability goes beyond; it tells you the very reason behind it. Traditional infrastructure tooling was built to answer the first question, but present-day AI systems demand the second report. As observability pioneer Charity Majors has put it, the practice is fundamentally about understanding any internal state a system can get into, purely by questioning it from the outside.
.avif)
Traditional Monitoring Limitations: Why Metric Thresholds Fail AI Systems
Monitoring is the discipline of tracking a predefined set of metrics against known thresholds, aka CPU load, memory consumption, request latency, error rates, and row counts in a database. These are the vital signs of a system, and monitoring tools exist to watch them continuously and alert when one crosses a drawn line.
The core question monitoring answers is deceptively simple: is the system working?
This works well when failure modes are well understood in advance. A server that runs out of memory crashes in a predictable way. A pipeline that stops receiving rows produces a flat line an engineer can spot immediately. These are what's often called "known unknowns". But as research on observability engineering notes, modern distributed systems rarely fail the same way twice, which is exactly where a fixed-metric approach runs out of road.
This works well when failure modes are well understood in advance. A server that runs out of memory crashes in a predictable way. A pipeline that stops receiving rows produces a flat line an engineer can spot immediately. These are what’s often called “known unknowns”.
The limitation shows up the moment failure becomes semantic. A monitoring dashboard does not understand if a model's output is correct or incorrect. It cannot detect that the distribution of incoming customer queries has shifted, that a model is exhibiting subtle bias against a subgroup in a demography, or even that a summarisation model has started fabricating details in a way that reads as perfectly fluent and confident text. Recent research on multi-agentic AI systems makes the same point from the engineering side: LLM-driven systems are inherently non-deterministic, and behavioural drift or reasoning loops can develop without ever tripping an explicit error signal. Again, the infrastructure is fine, the row counts are fine too, but the meaning underneath has quietly rotted, and monitoring has no eyes for meaning.
[related-1]
AI Observability Defined: Moving from System Alerts to Semantic Diagnosis
Observability takes a different starting position. Rather than watching a fixed list of known metrics, it works from the outside in: given the outputs a system produces, can you infer enough about its internal state to explain why it behaves the way it does? This is done by weaving together logs, metrics, traces, and evaluation data into a picture detailed enough to support real diagnosis, not just detection.
The core question observability answers is: why is the model behaving this way, and what is the root cause?
The 4 Core Pillars of AI Observability Best Practices
In an AI context, this diagnostic lens tends to rest on a few key pillars:
- Data drift: is the shape of incoming data diverging from what the model was trained or tuned on? Data drift is often described as a silent killer of machine learning models. Detecting it typically relies on either supervised methods, or unsupervised statistical approaches.
- Model bias: are the outputs being generated systematically favouring or disadvantaging certain inputs in a way that was not intended? NIST's AI Risk Management Framework treats "fair with harmful bias managed" as one of seven core characteristics of trustworthy AI, alongside validity, safety, and explainability.
- Prompt and pipeline lineage: for LLM-based systems, what prompt, the retrieved context, and the chain of transformations produced an output, and can that chain be traced back after the fact?
- Hallucination and factual drift: is the model generating content that sounds plausible but doesn't hold up against ground truth or source material? OpenAI researchers have argued that hallucinations are a near-inevitable byproduct of how language models are trained and evaluated.
None of these questions can be answered by a CPU graph. They require tracing a request through every step of its journey so that when something looks wrong, an engineer can walk backwards through the chain instead of guessing.
[related-2]
The Reproducibility Gap: Why Legacy APM Tools Fail LLMs and AI Agents
Many organisations attempt to solve this by pointing their existing Application Performance Monitoring (APM) tools at their AI systems and calling it done. This tends to fail for a structural reason: APM was designed for deterministic software, where the same input reliably produces the same output, and a bug is a bug. Carnegie Mellon's Software Engineering Institute has documented how this reproducibility gap is exactly what makes testing, evaluation, and validation of ML systems fundamentally different from traditional software QA. LLMs and autonomous agents are non-deterministic by design; the same prompt can produce different outputs, and "correctness" is a probabilistic, context-dependent judgment rather than a pass/fail test.
Another big mistake data teams often make is that they pause at the symptom layer itself without investigating the core.
Think of this: 'Accuracy dropped three points this week' is not a diagnosis; instead, a mere observation.
Architectural Strategy: Embedding AI Observability into the Data Platform
Questions like: Was there a shift in the underlying data distribution? A change in an upstream pipeline? A new model version quietly pushed to production? A change in retrieved context for a RAG system? must be addressed, as without it teams end up firefighting the same symptoms repeatedly.
This is where the architectural remedy becomes less about bolting on another dashboard and more about rethinking the data platform itself. A unified data product platform with natively embedded observability and governance into the pipeline rather than layered on afterwards empowers teams to trace an anomaly from a model’s output all the way back through retrieval, transformation, and ingestion in a single continuous view. Instead of stitching together logs from five disconnected tools during an incident, the lineage is already there, because it was captured as a first-class part of how data moved through the system in the first place.
Monitoring and observability are 2 different philosophies, if not poles apart. These can never be treated as either/or choices. Think of monitoring as the smoke detector that tells you the moment something’s wrong, while observability is the fire investigator informing you which wire actually sparked. AI systems can’t do without either of them.
FAQs
Q1. Why can’t traditional APM tools handle AI systems?
APM tools were built for deterministic software where a given input always produces the same output. AI systems, especially LLMs and autonomous agents, are probabilistic, making the same input yield different outputs, and “correctness”, which APM has no framework for evaluating.
Q2. Does adding observability introduce significant performance overhead?
Well-designed observability typically adds a small, manageable overhead when built into the pipeline from the very start. The overhead grows much larger when teams try to bolt tracing onto a system after the fact, often through inefficient, duplicated logging layers.
Q3. How does observability apply specifically to RAG (Retrieval-Augmented Generation) systems?
RAG introduces an additional failure surface: the retrieval step itself. Observability for RAG means tracing which documents were retrieved, why they were ranked as relevant, and how they influenced the final generated output, making it possible to distinguish a generation problem from a retrieval problem when an answer goes wrong.
Connect with a community data expert
A no-cost session with a practitioner who's been where you are.
About Modern Data 101
Modern Data 101 is a movement redefining how the world thinks about data. A community built by the same team behind the world’s first data operating system, Modern Data 101 sits at the intersection of data, product thinking, and AI. Spread across 150+ countries, the community brings together a global network of practitioners, architects, and leaders who are actively building the next generation of data systems.
At its core, Modern Data 101 exists to simplify the journey from raw data to tangible and observable impact. It advocates high-potential data systems and next-gen architectures to unify and activate insights and automation across analytics, applications, and operational workflows at the edge.
In a world shifting from data stacks to AI ecosystems, Modern Data 101 helps teams not just navigate the change but lead it.


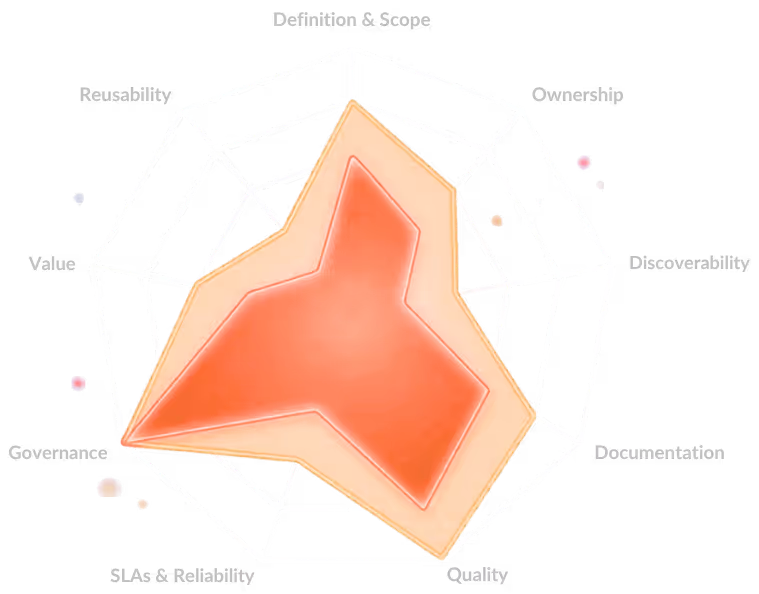
Where does your org stand on data product maturity?
A 9-dimension self-assessment used by 100+ data teams to benchmark strategy, ownership, and platform readiness.


Rakesh Vishvakarma
Rakesh is a data engineer who transforms raw data into fine wine. When he's not using AI to tag tables or make spot-on recommendations, he's deep into philosophical books or ones with more twists than his latest ETL pipeline, pondering existence and data governance.
Read the ideas here. Build them with The Modern Data Company.
Modern Data 101 is where the data community thinks out loud. When you're ready to move from articles to architecture, data products, governed AI pipelines, or a full Data Operating System; the team behind this community can help you build it.
.png)
.png)

.png)