


Access full report
Oops! Something went wrong while submitting the form.

🤍

Facilitated by The Modern Data Company in collaboration with the Modern Data 101 Community
Latest reads...
%20(1).png)
.png)
TABLE OF CONTENT


Part 1: What is a Data Product and Key Differentiators
Part 2: What Problem Do Data Products Solve in Modern Enterprises
Part 3: What is the Anatomy of a Data Product
Part 4: What are the Core Features of a Data Product
Part 5: What Are the Key Types of Data Products
Part 6: What is the Data Product Lifecycle
Part 7: What are the Stages in the Data Product Lifecycle
Part 8: How to Measure Data Products
Part 9: How a Single Data Product Supports Multiple Business Use Cases
Part 10: How to Practically Implement Data Products
Part 11: Key Roles and Responsibilities for Data Product Management
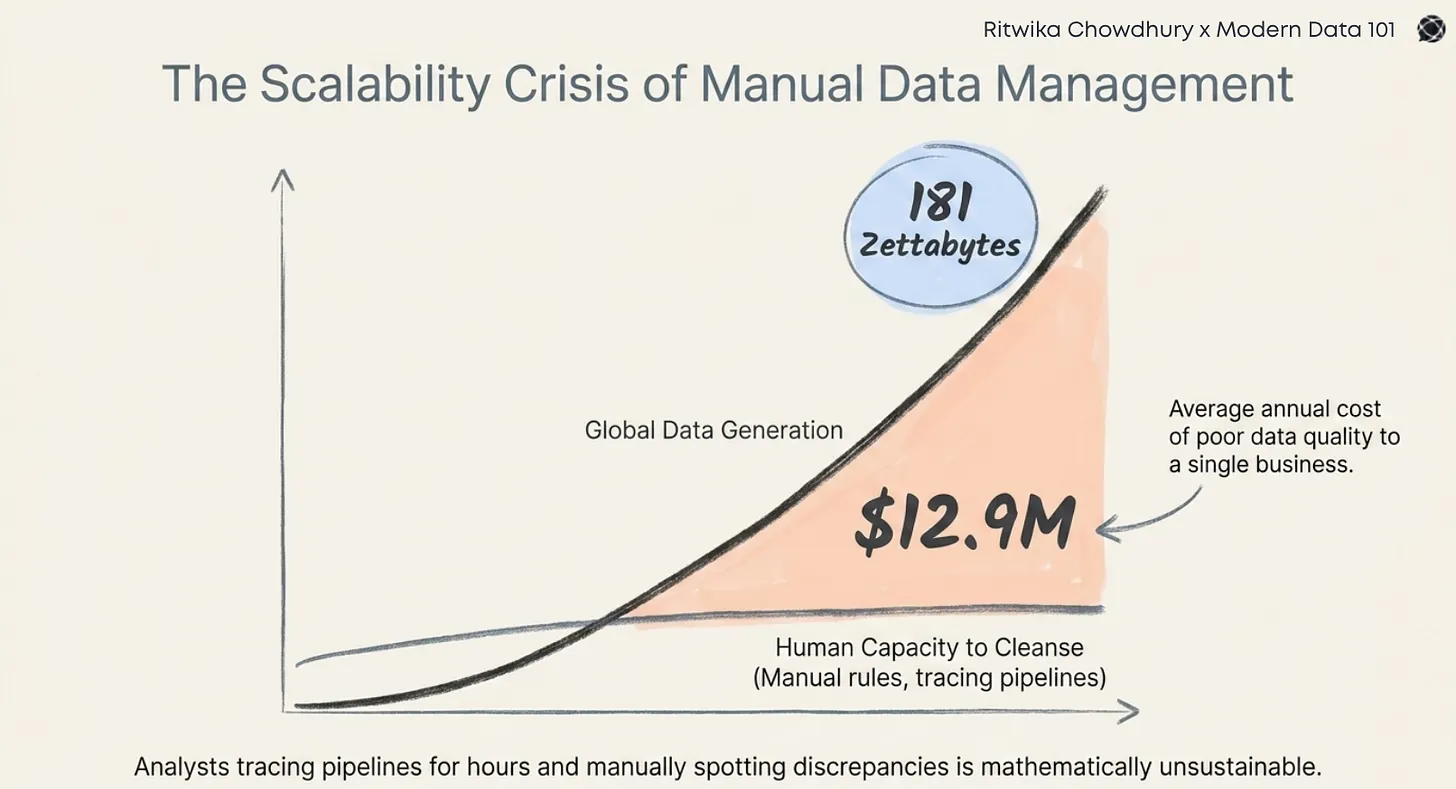
In this fast-paced world, every modern data product ecosystem wants faster decisions at lower prices and with greater revenue. But this requires businesses and technologies to keep up and make changes in the ways they handle their data.
And speaking of data, there’s one term that has gained significant traction, i.e. “data product”. But does its popularity also align with its correct interpretations? Considering that it is a new concept, are organisations that want to utilise it able to understand it and see it beyond the lens of rebranding existing assets and just dashboards or machine learning models?
This article is about breaking down the understanding of a data product at a structural level, while opening up about questions like who owns the data, who is accountable for it, and how it is defined.
Imagine being an employee in an organisation who wears multiple hats, serves different clients, manages conflicts, and doesn't require constant monitoring. That's the expectation from most professionals in the AI age, where the new skills go beyond individual contributions. The role of people managers is disappearing.
The expectations from data today are also not too different. Consider how convenient it would be if businesses could rely on data repeatedly, without reinterpretation? This is where the concept of a data product enters the conversation, not as just another dataset, but as data intentionally designed to be accountable, trustworthy, reusable, and dependable at scale.
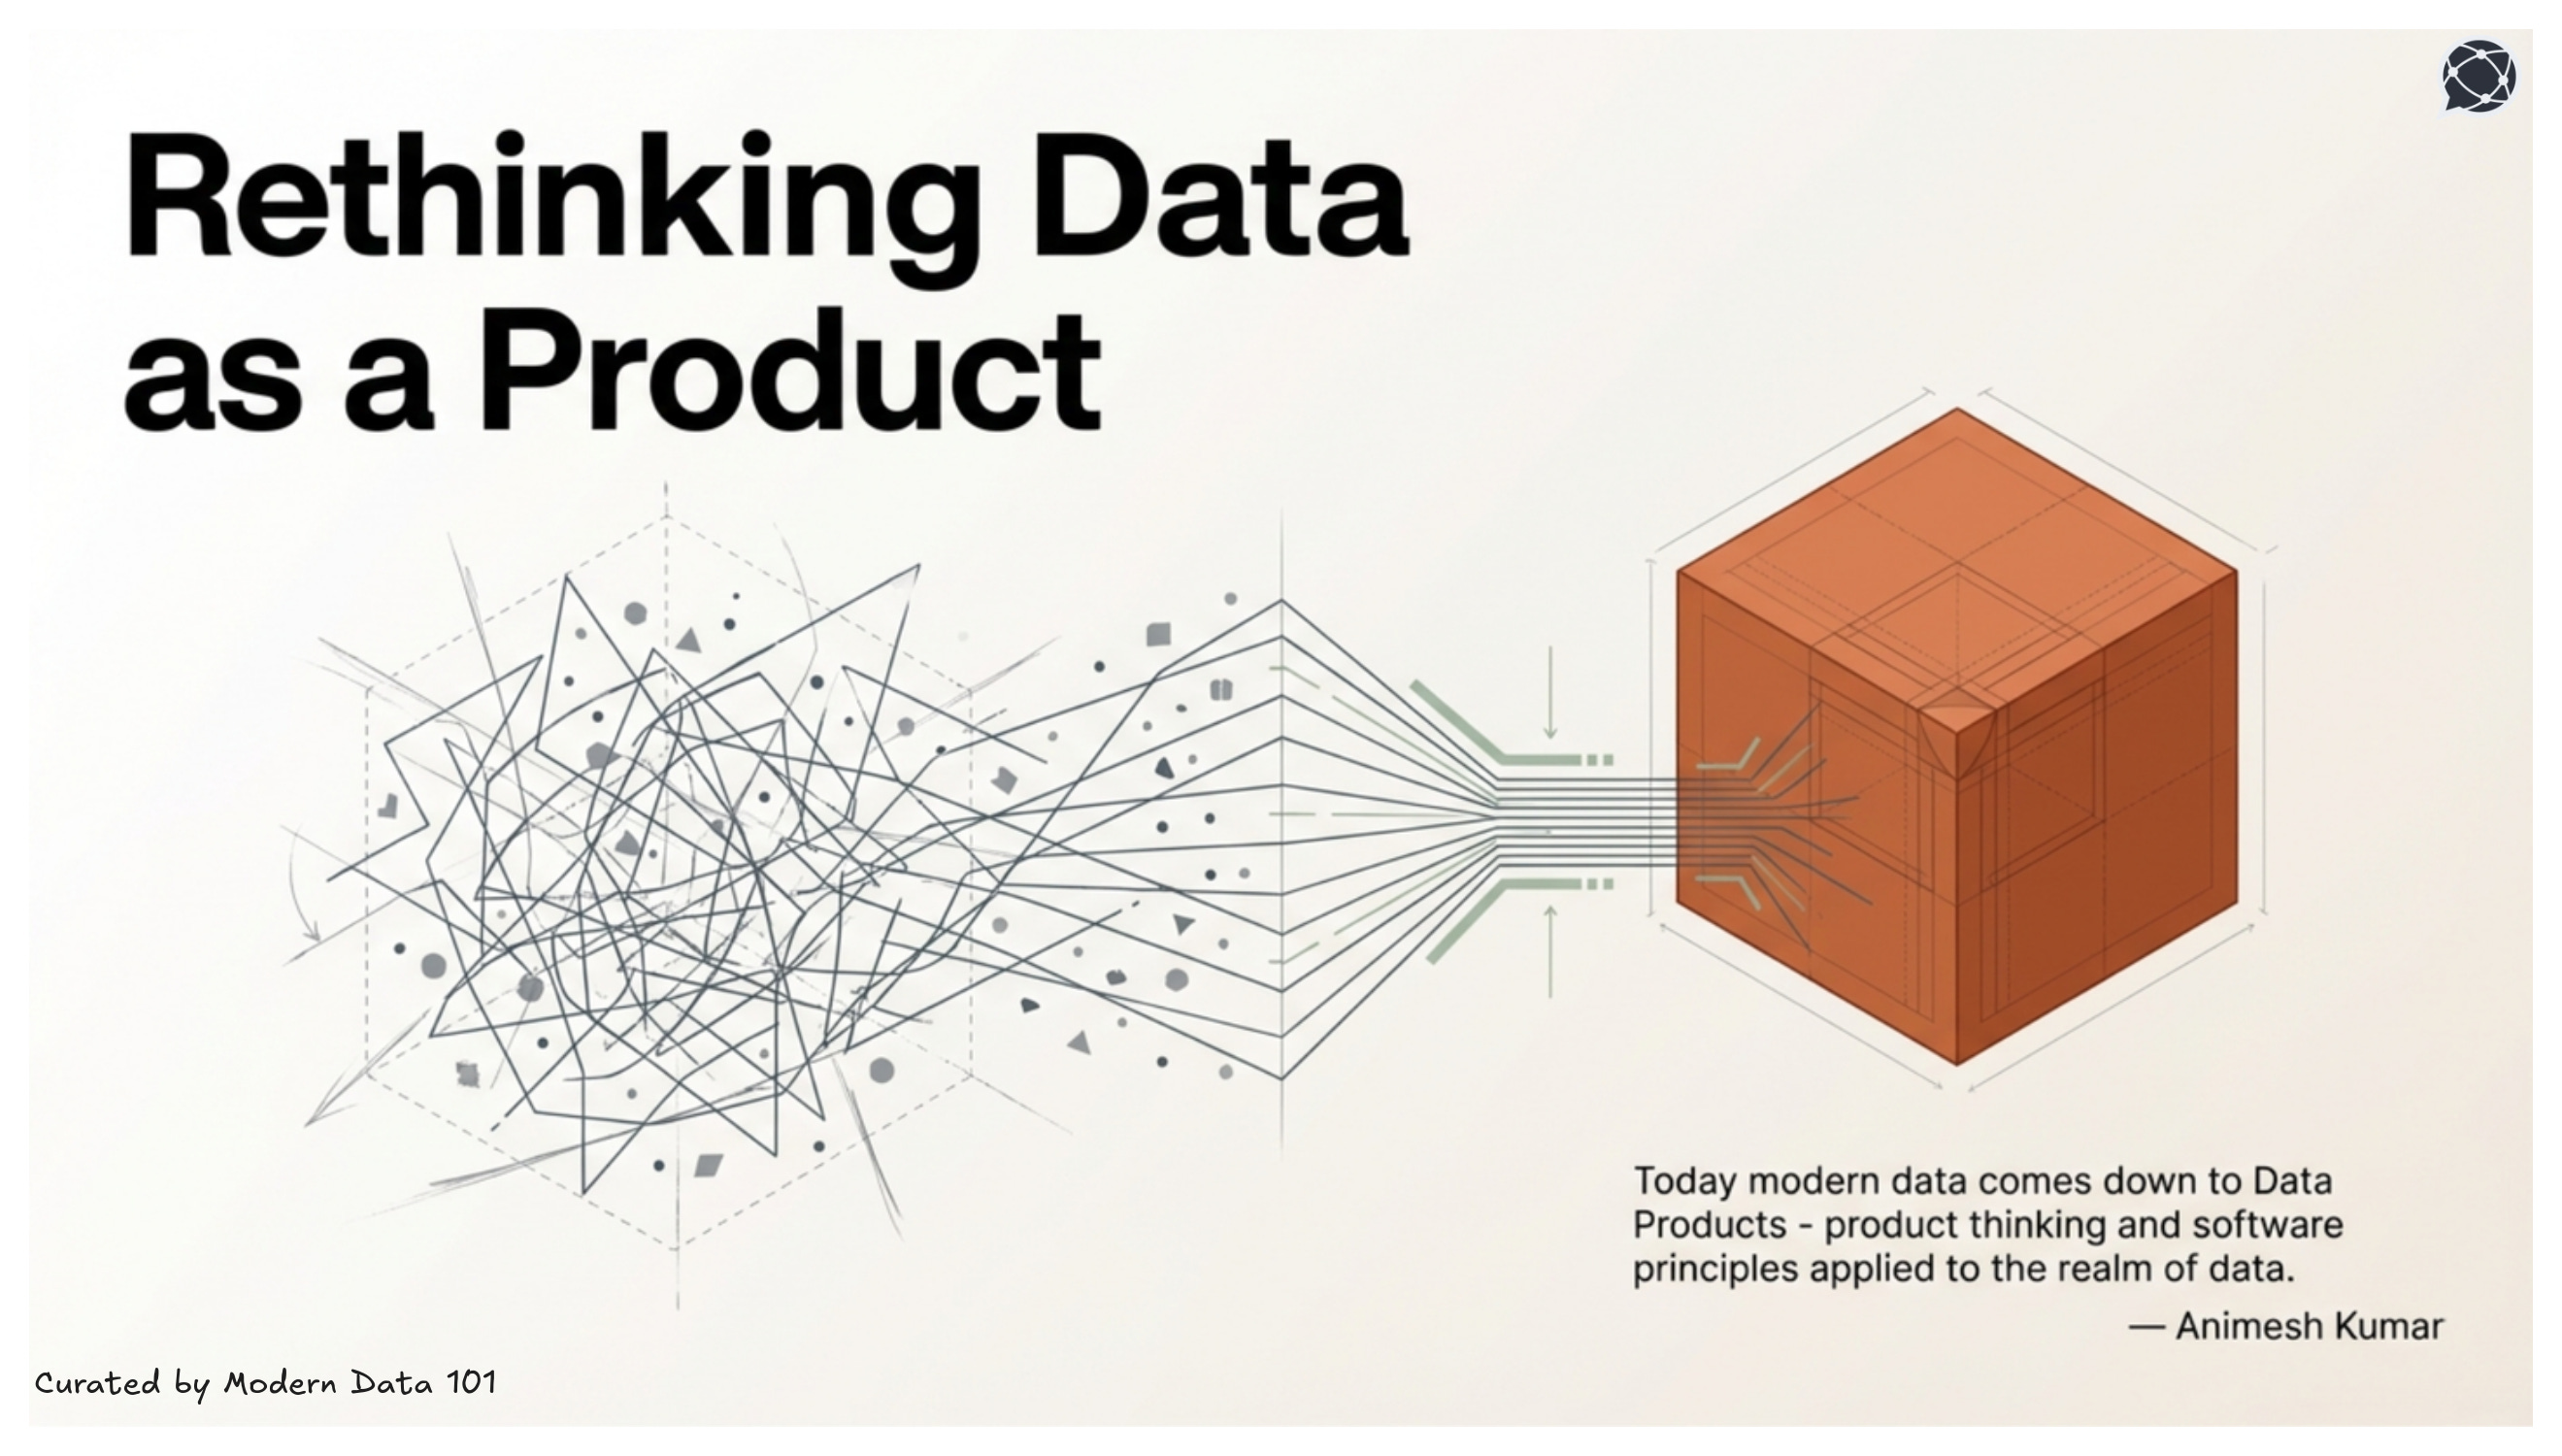
A data product is a curated, reliable, and reusable purpose-bound data asset built for ongoing use, intentionally designed to support decisions over time rather than serve as a one-off dataset or dashboard. It operates within a defined domain boundary, with a stable data model, embedded validation logic, and clearly defined access mechanisms. It is documented, discoverable, and continuously monitored for quality.
A data product is self-contained, governed, and reusable unit of data designed to deliver specific business value.
In our framework, a data product is a "vertical slice" of the data architecture that includes the data itself, its metadata, transformation code, SLAs, and the necessary infrastructure to make it consumable. This enables a move away from "fragile pipelines" toward a "Lego-like" system where these modular data products can be snapped together to build complex applications quickly.
This perspective reinforces the idea that data is not merely stored and governed, but intentionally engineered, packaged, and delivered for repeatable consumption, much like any well-designed product.
“For greater responsiveness and a higher benefits realisation ratio, ‘product-mode’ is a more effective way of working than projects.” - Martin Fowler.
Martin Fowler, one of the greatest minds shaping systems design, argues that real responsiveness comes from structuring teams around enduring outcomes rather than temporary projects. He suggests that value increases when stable teams stay accountable for solving problems over time, continuously validating and improving results. In this view, effectiveness is measured by sustained business impact, not by delivering predefined scope.
Additionally,
IBM Think defines that
...a data product is a reusable, self-contained combination of data, metadata, semantics, and implementation logic designed to deliver consistent value across use cases, much like a commercial product serves customers in a market.
To understand this better, it’s important to recognise that a data product is intentionally designed to solve users’ problems and is developed with the same discipline and structure as any other product, which means prioritising high-value features, managing iterations based on feedback, and presenting clear ownership and accountability.
The Gartner Chief Data and Analytics Officer (CDAO) Agenda Survey for 2024 shows that,
...1 in 2 organisations studied have already deployed data products, defined by Gartner as a curated and self-contained combination of data, metadata, semantics and templates.
Another industry pioneer in the data product space, Thoughtworks, cites the following:
While the term “data product” has been employed with different definitions, in the context of DaaP, data products, just like traditional products, are valuable and functional on their own, addressing specific business needs or goals. They encompass all the essential components needed for their utilisation: not just data, but also relevant metadata, the code required to transform and present the data, governance policies, quality processes, and the infrastructure required to publish and operate it.
[related-1]
Why Does Consumer Intent Define a True Data Product
Because the whole point of productisation begins with purpose: design as per the need to create a decision-centric data product. Interfaces are designed deliberately, quality thresholds reflect real usage expectations, and evolution becomes intentional rather than reactive.
This shift marks a change from passive storage to purposeful design. Additionally, defining a clear consumer, whether for operational decisions, analytics, reporting, or integration, helps to introduce direction and accountability.
Modern data environments are expanding every day, more so with AI interactions. It is important to accommodate a feasible and useful interaction with data and its growing use. These days, organisations involving self-serve analytics, cloud-native systems, and domain-oriented ways of working require stability, which is presented by treating data as a product.
And since data product has features like clear ownership and structural discipline, it prevents definitions from drifting by aligning with the drifts themselves in data consumption patterns, infrastructure, and code. Ironilcally, being "duplicated", or forked in case of data products, increases trust instead. Data product brings structural discipline to an environment that would generally be fragmented under scale or consumption-heavy in nature.
In addition to this discussion, it has been acknowledged by Thoughtworks that applying product thinking to data starts a journey of focused management of data to adhere to consumer needs instead of letting infrastructure or process dictate usage.
Changing the way we reframe data presents an opportunity to build assets that ensure customer-centricity, instead of just delivering outputs based on new tooling. Because now, we are focusing on the design intent.
Through this methodology, it becomes possible to align data products from their raw data form into structured, accessible, and valuable assets. IBM also supports such an approach by highlighting how proactive decision-making and alignment with business goals can be achieved seamlessly.
So, in environments where reusability, composability and trust are the core aspects, this shift becomes a foundation rather than just an option.
The term "data product" is often misused because as soon as any form of data initiative or structured artefact starts to expand, it gets labelled as a “product”. However, what we fail to identify is that in order to qualify as a product, we have to observe the capabilities instead of the in-the-moment outputs presented. Like ownership, accountability, and intentional design for long-term consumption.
But if these elements are missing, the label that was expected to present clarity, reflects confusion. This also leads to misuse once structure gets misunderstood as data stewardship, further preventing the purpose of a label.
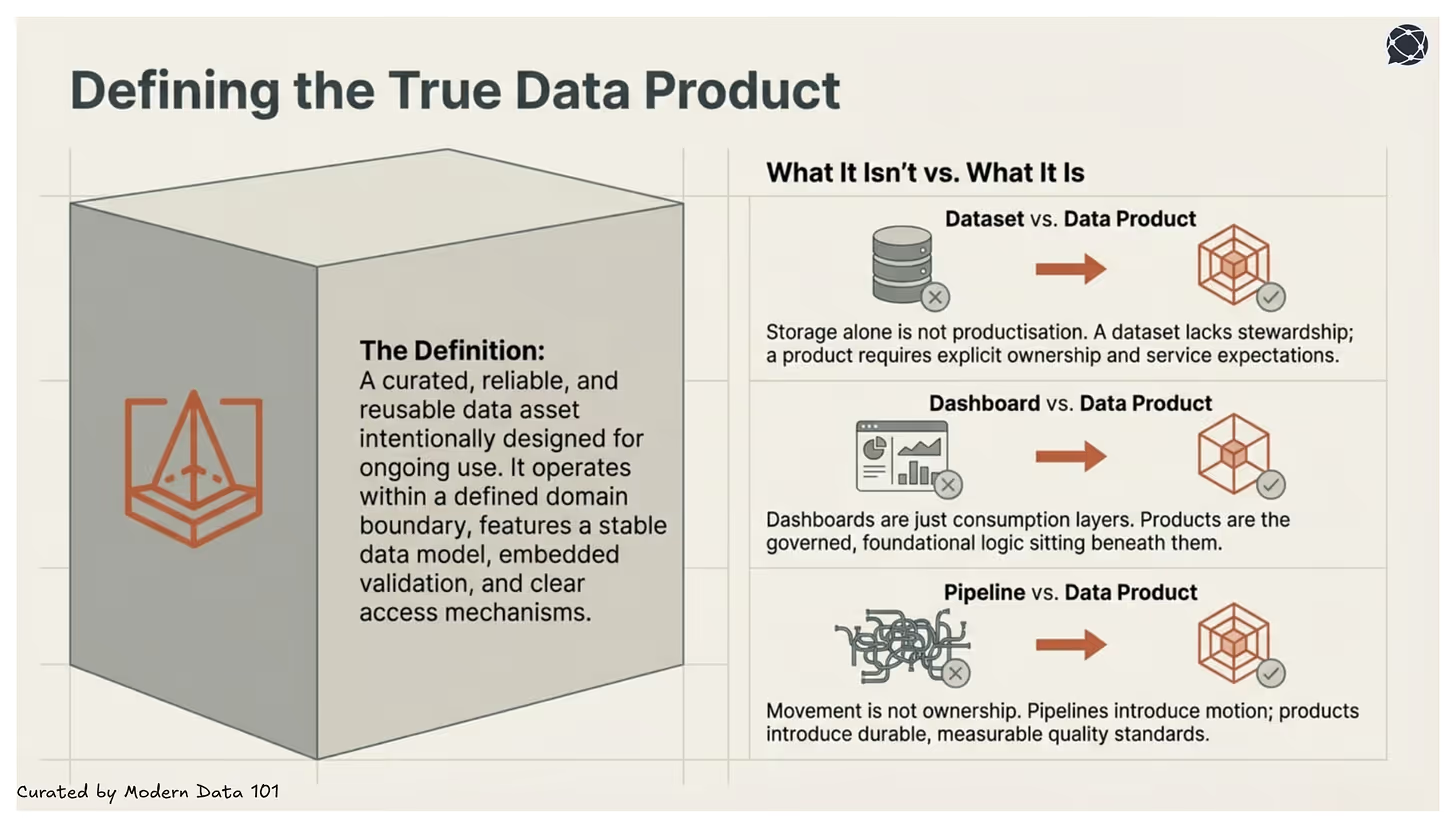
A dataset is a stored and structured collection of data. It may be well-modelled and queryable, but storage alone does not constitute productisation.
A dataset refers to an asset which is valuable in nature but not engineered for durable consumption or direct enablement of business goals. It also often lacks attributes such as being FAIR (findable, accessible, interoperable, reusable) in nature and having consistent governance.
However, a data product requires explicit ownership, defined service expectations, embedded quality controls, and long-term accountability. It simply can’t function without stewardship and consistently active business or consumer orientation.
Dashboards and reports serve as consumption layers as they do not define or govern the underlying logic but only interpret and visualise data to support decisions.
What we are looking at when speaking about data products is a foundational product which is inclusive of stable definitions, data’s governed access, and consistent metrics that dashboards depend on.
This exists and thrives beneath these interfaces of dashboards and reports, and also prevents duplication and inconsistency while guaranteeing integrity.
Pipelines move and transform data. They streamline and direct the flow across systems. But movement is not ownership.
A pipeline is capable of delivering a table, but a data product presents reliable consumption while maintaining measurable quality standards and accountability.
A pipeline can also NOT ensure semantic consistency and long-term quality. But a data product is streamlined in its procedure and productisation by being durable, while pipelines only introduce motion.
It takes the convergence of three forces: stable semantics, embedded governance, and a clearly defined consumer purpose to create a data product. At that point, data ceases to be a by-product of systems and becomes decision infrastructure. Additionally, it shifts the focus from delivering outputs to maintaining dependable infrastructure that others can rely on repeatedly.
[related-2]
The concept of a data product emerged to address the failures of traditional data delivery and create an efficient response towards structural inefficiencies of data maintenance or dataOps
As data ecosystems scale, these inefficiencies compound, resulting in fragmentation, inconsistency, and declining trust. To prevent this, productisation becomes necessary.
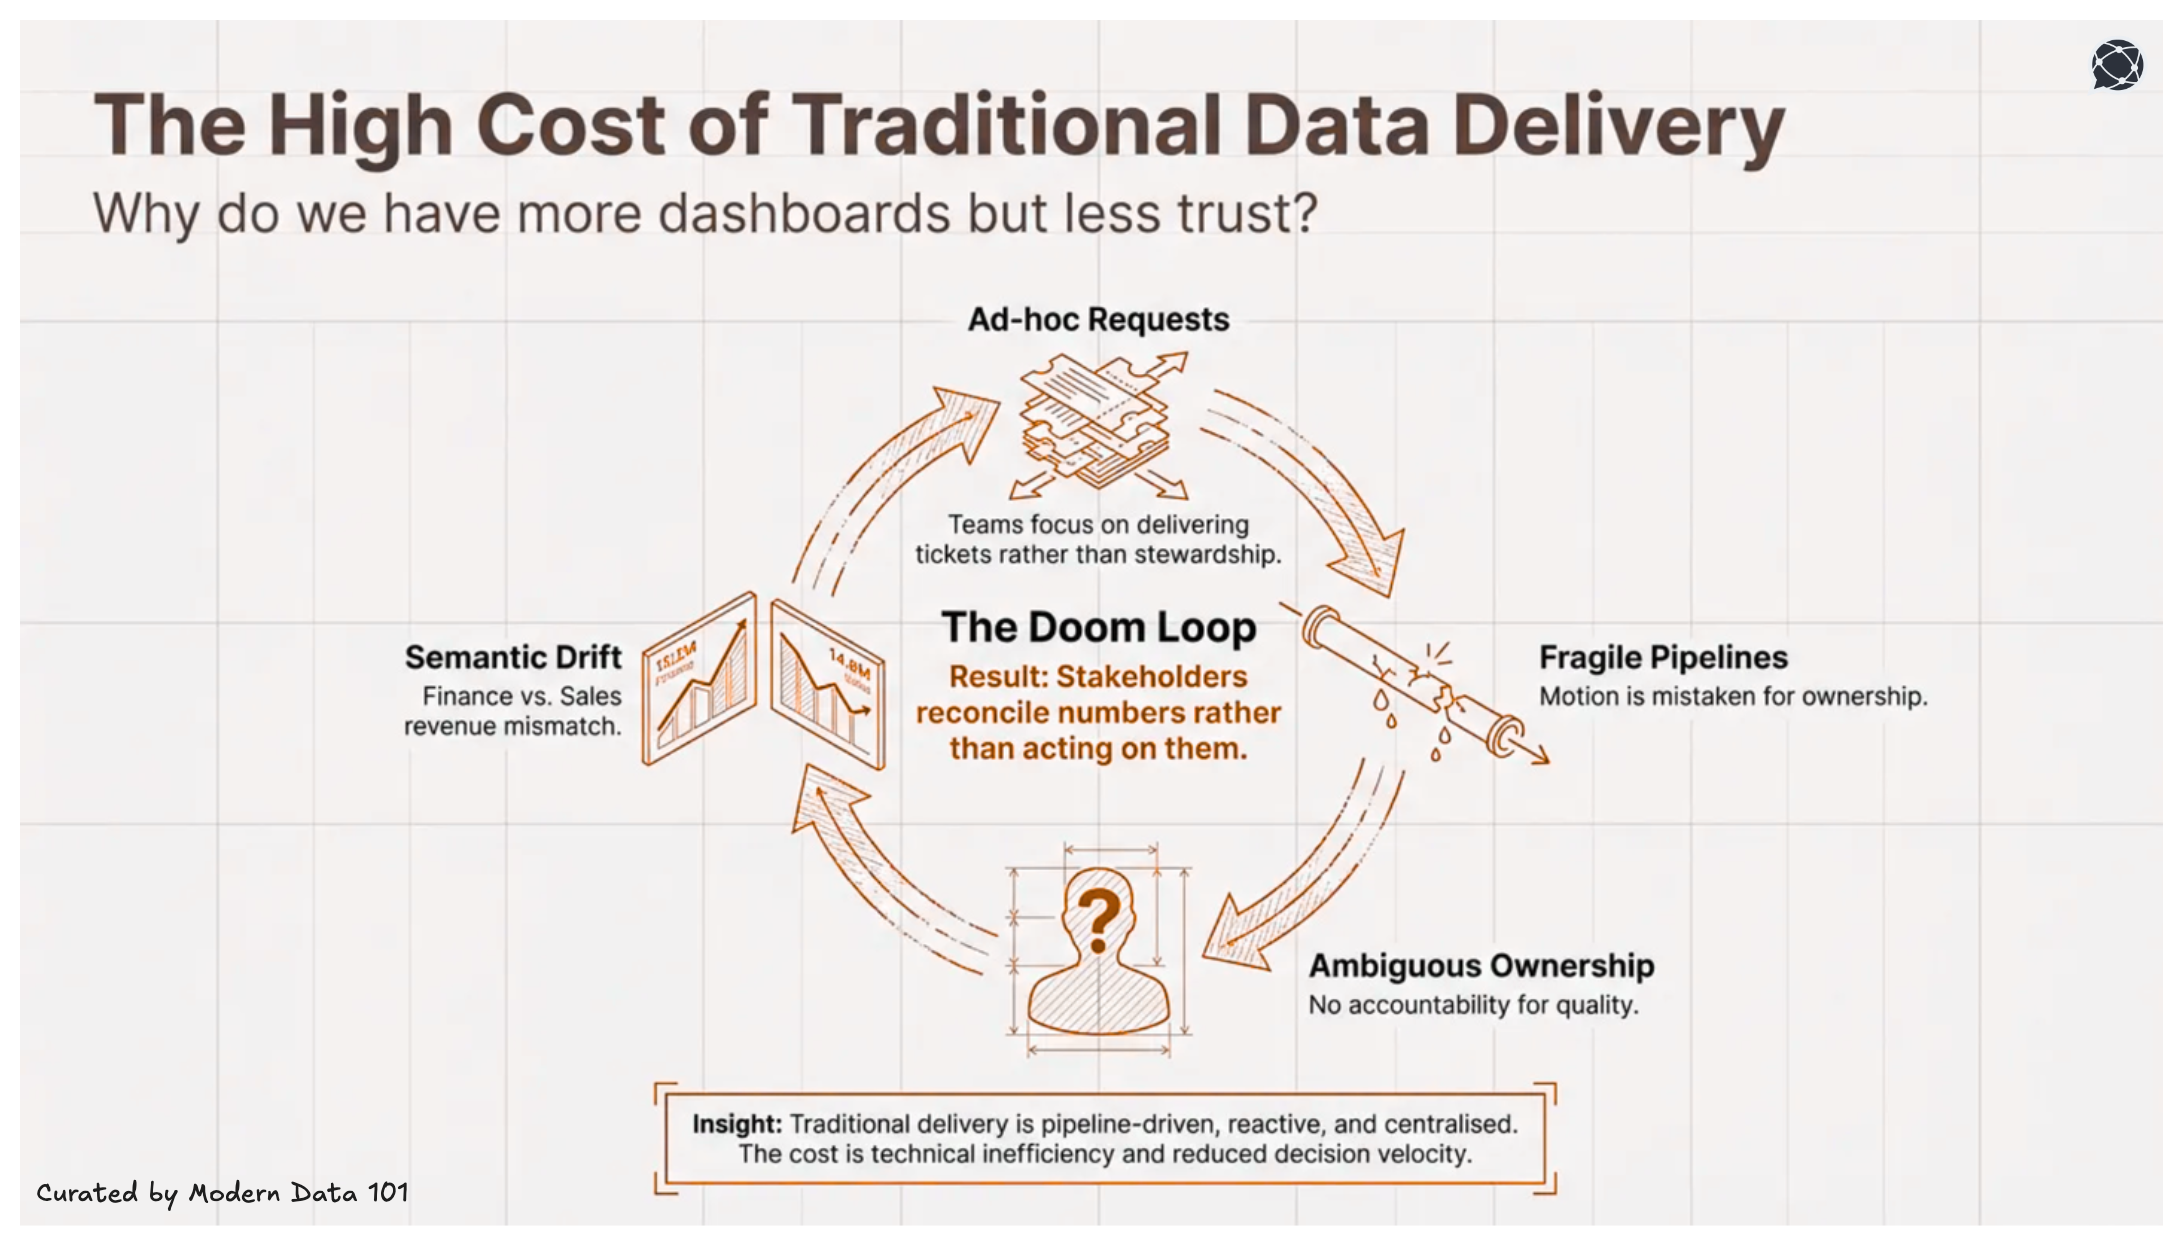
Teams are focused on moving on to the next ticket rather than building long-term usability. The traditional data delivery method revolves around being pipeline-driven, reactive, and centralised.
Another major flaw in the system is served when ownership remains ambiguous, and once delivered, assets are rarely governed with explicit accountability for quality, definition, stability, or service expectations.
This overall model is a structural weakness with ad-hoc analysis, reporting and pipelines accumulating over time, no specific request being converted into a reusable foundation, and centralised teams becoming bottlenecks as demand scales.
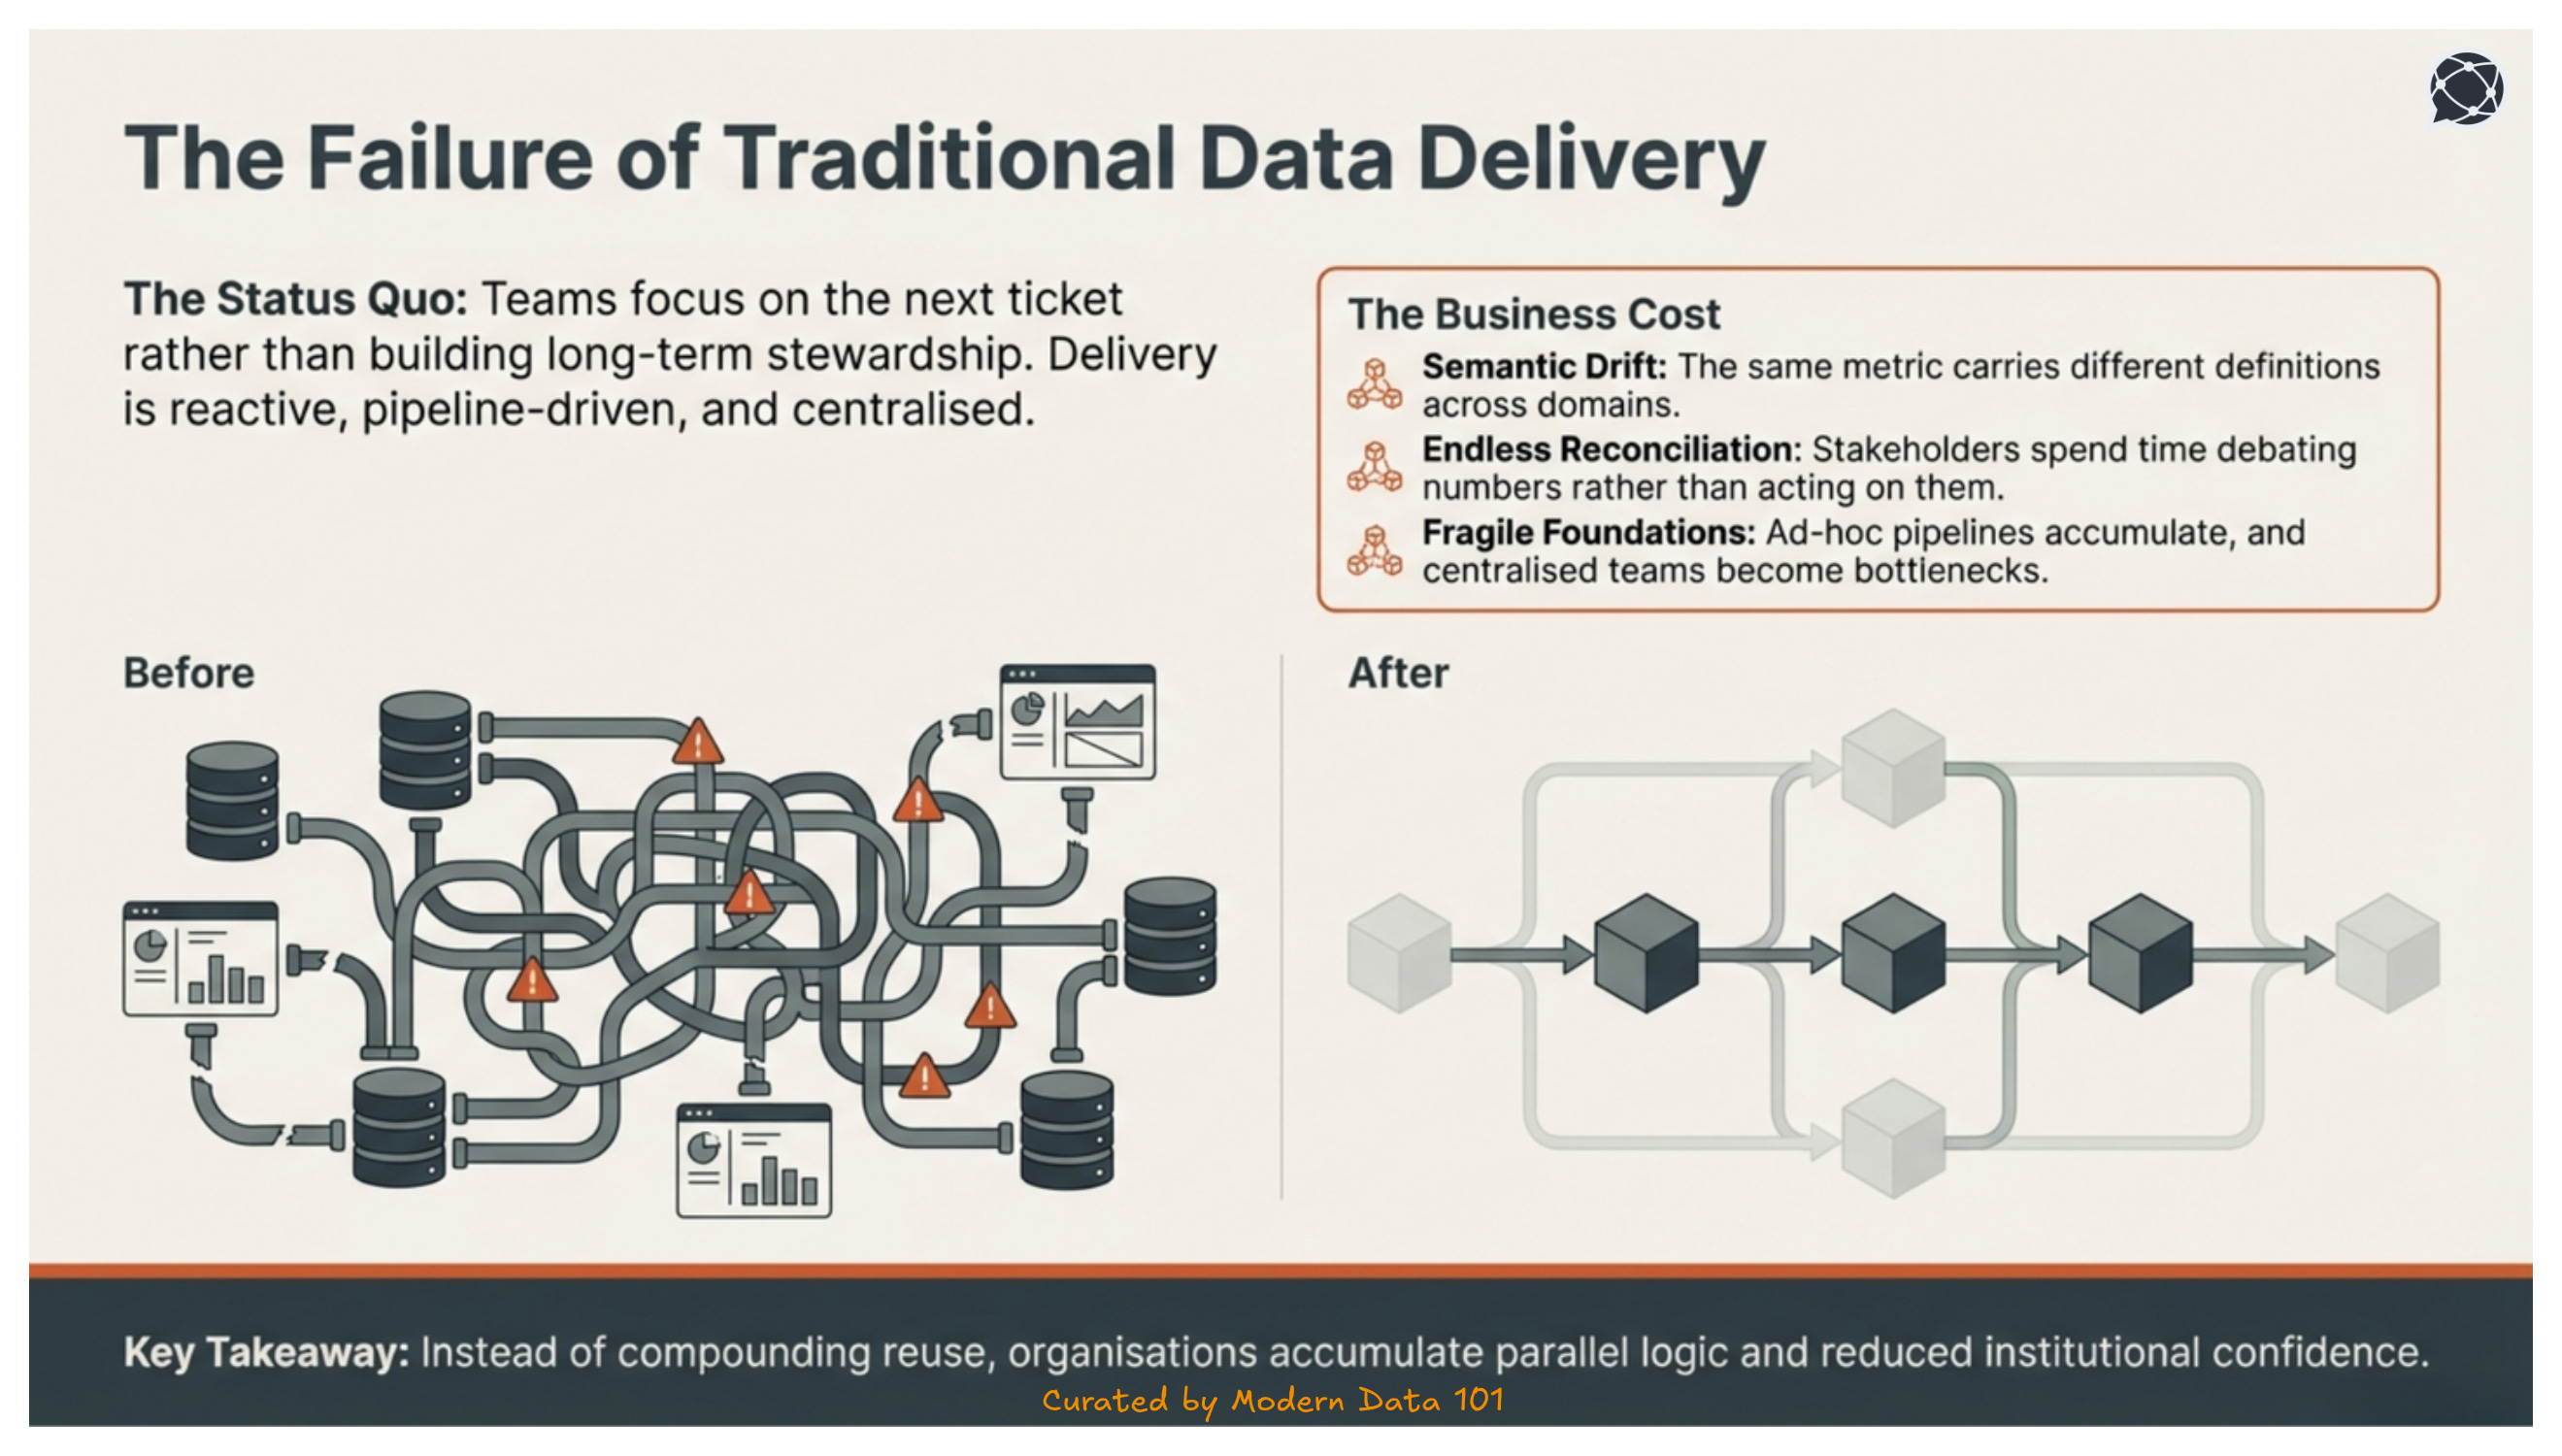
Multiple disadvantages starting from systematic duplication, similar transformations for different use cases and finally, a semantic drift, and it is the same metric carrying different definitions across reports and domains.
All this also leads to:
The cost is not only technical inefficiency but reduced decision velocity and institutional confidence.
A data stack includes tools for ingestion, transformation, storage, and visualisation in a modular and scalable manner. However, a data product still needs other components than this for operation to result in a governed, consumer-oriented asset that leverages the stack but is not defined by it.
In this sense, data products sit at the intersection of architecture and accountability, leading to the conversion of technical capability into durable, reusable decisions.
Also, a data product is a consumable outcome built on top of a data developer platform. The platform provides primitives; the product provides structured value: this is a platform thinking perspective that enables capabilities, storage, compute, access control, and observability.
Related read: Death to Data Pipelines: The Banana Peel Problem.
To ensure that a data product has matured, it is important to understand that it does so through design. But when we strip down the idea even further, it opens up the gate towards first principles like a table, a transformation or an interface. But it takes a coordinated system along with responsibility and guarantee to create results with reliable outcomes.
For a data product, it is the integration that differentiates it from a well-modelled dataset. This is where each component has a role, and that role reflects durability. If you look at it, it is all interconnected: one gets removed, and others begin to lose context and purpose.
A mature data product is therefore not defined by a single artefact, but by a set of integrated elements that ensure PURPOSE, attribution, independence, stability, reusability, and governance at scale.
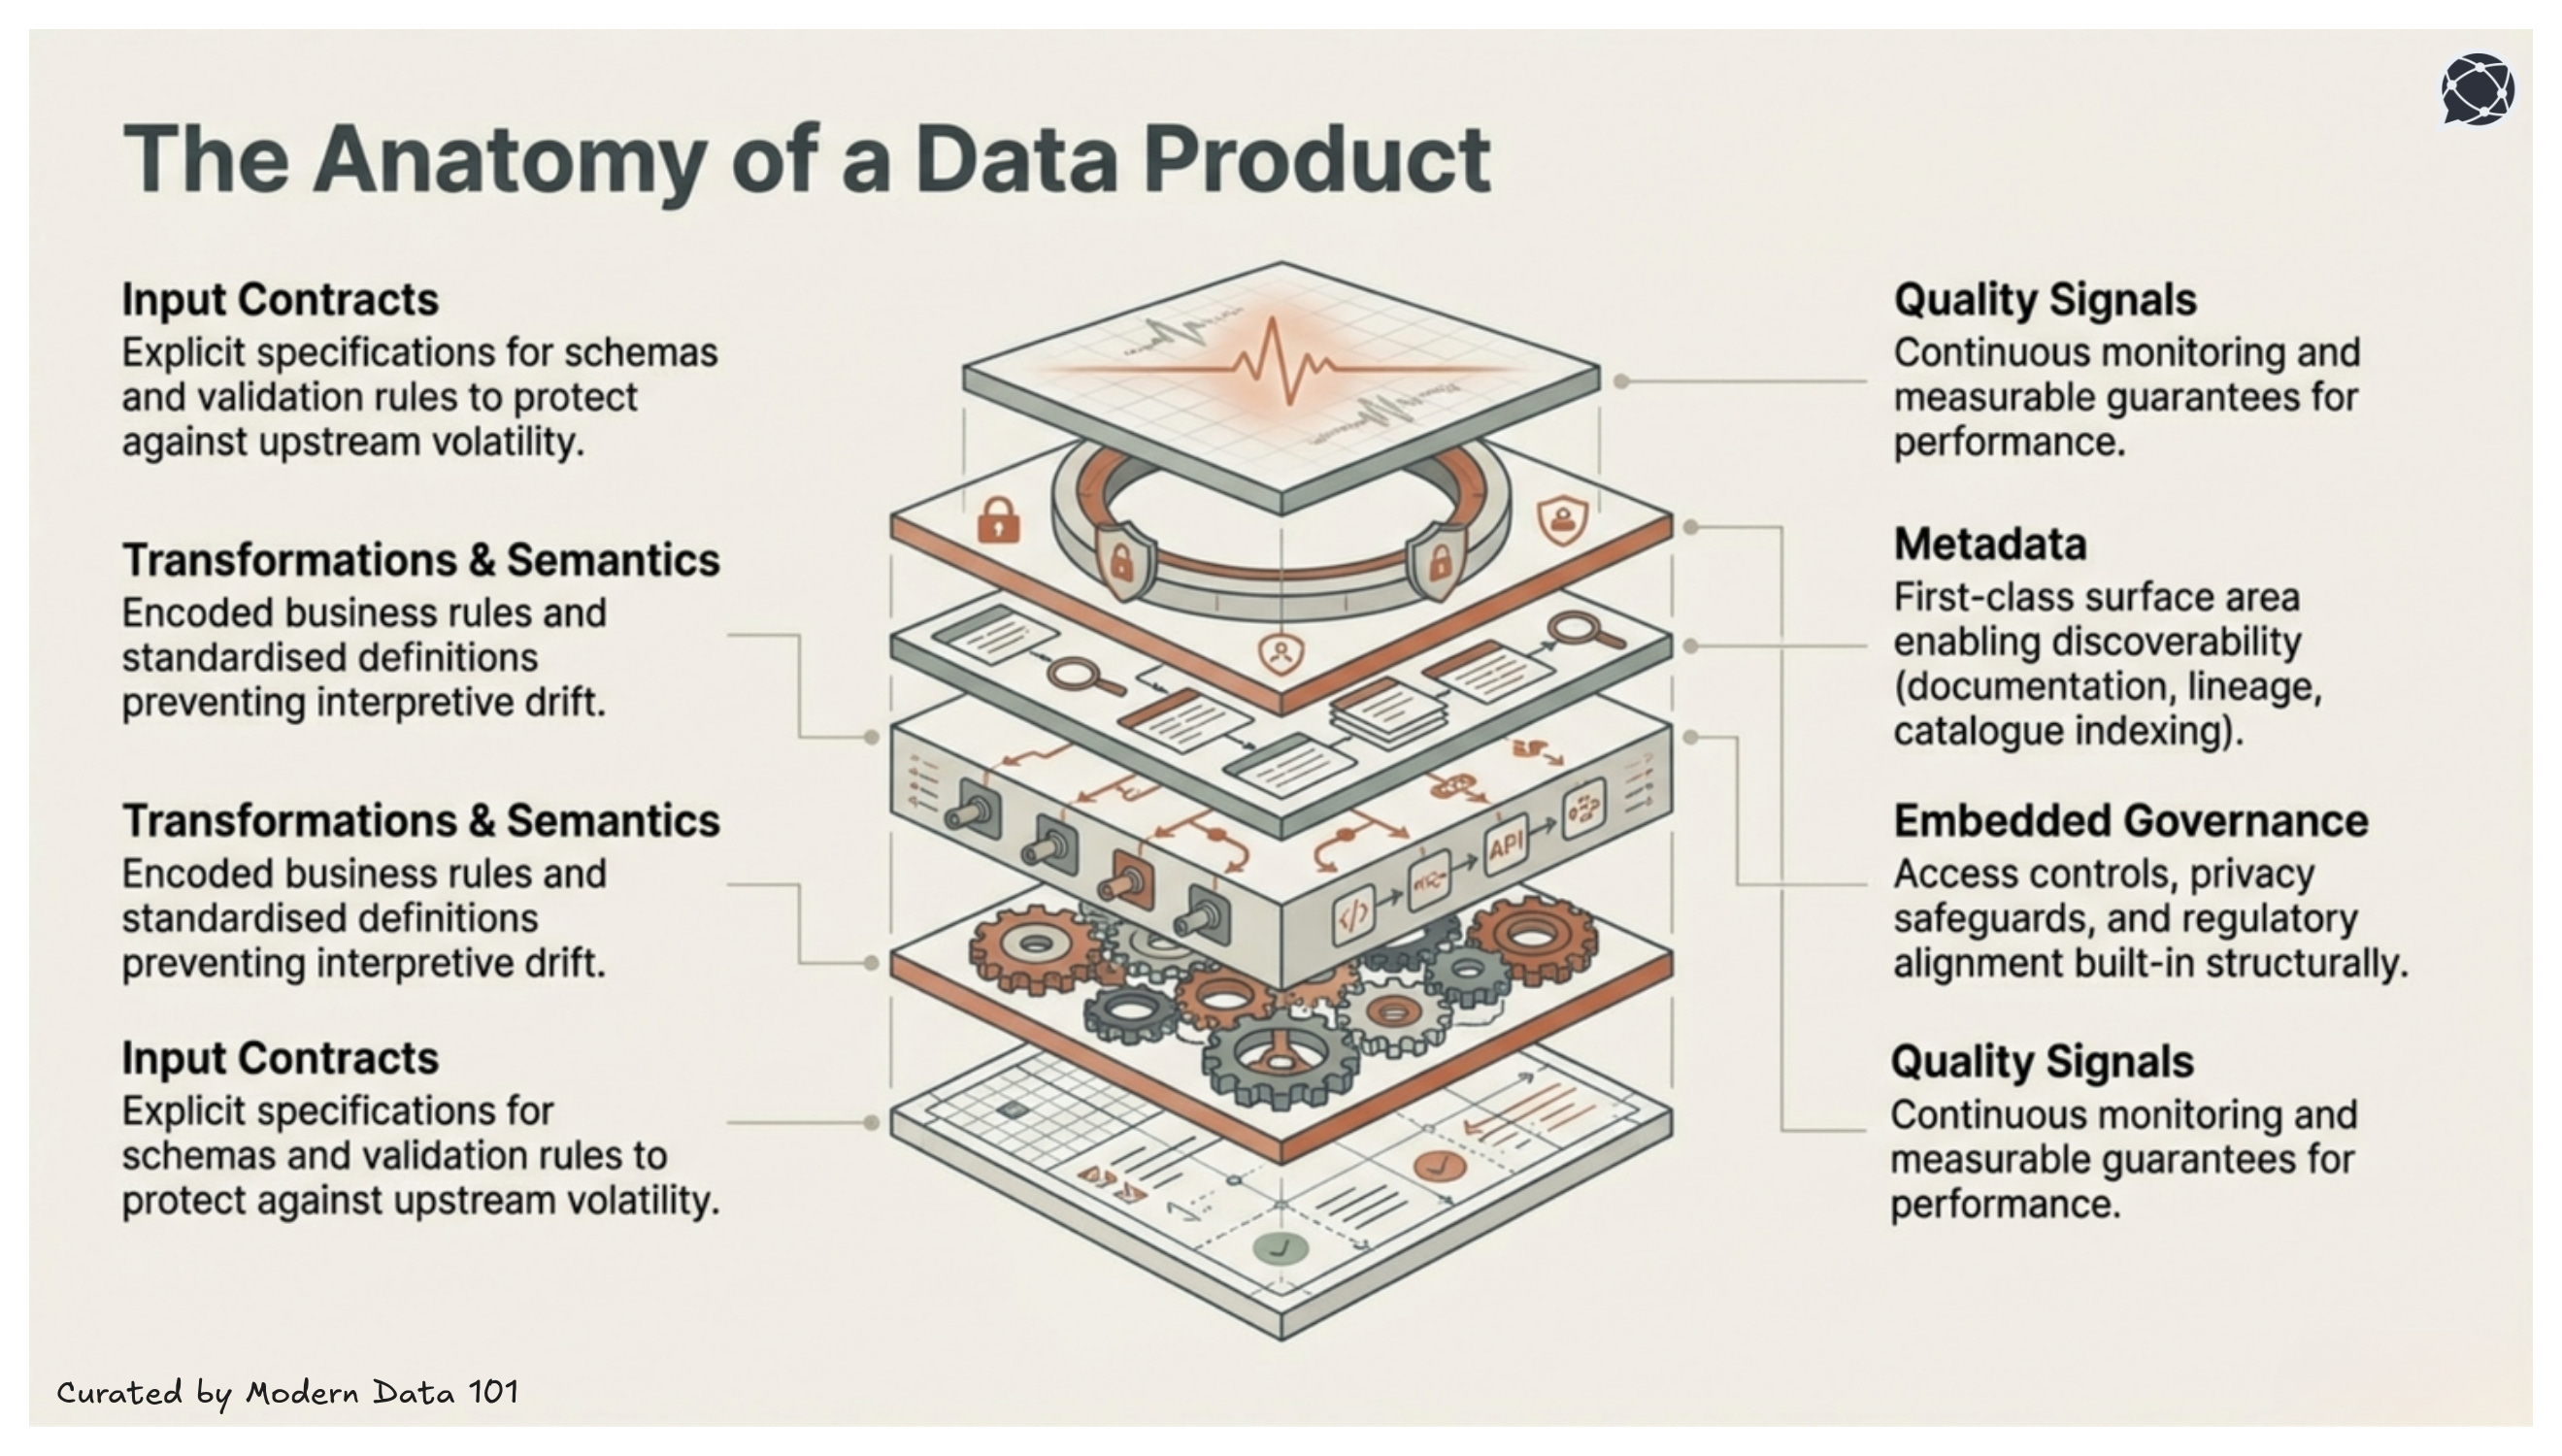
Data products define structured input expectations. Source systems are integrated through explicit data contracts that specify schema, data types, validation rules, and change management processes. This reduces upstream volatility and protects downstream consumers from unexpected structural shifts.
Transformation logic is not merely technical manipulation. It encodes business rules, metric definitions, and domain logic. Semantics are documented and standardised to prevent interpretive drift. This layer ensures that derived metrics remain consistent across consumption contexts.
A data product exposes deliberate access mechanisms, such as SQL endpoints, APIs, governed data shares, or derived views. These interfaces are stable, versioned when necessary, and designed for predictable consumption patterns.
Documentation, data lineage, ownership details, data classifications, and usage guidance are treated as part of the product itself. Metadata is not an afterthought; it is a primary interface that enables discoverability and trust.
DataCamp notes that metadata and documentation are core to making data products user-friendly, discoverable, and reusable as key factors that distinguish them from unmanaged data artefacts.
Access controls, policy enforcement, regulatory alignment, and data protection mechanisms are integrated into the product’s design. Governance is implemented structurally rather than retrofitted through manual review processes.
A data product defines measurable quality thresholds, such as freshness, completeness, accuracy, and reliability. Monitoring systems track these indicators continuously. Where appropriate, service-level guarantees formalise expectations for availability and performance.
[related-3]
Usage is anticipated and observed. Whether supporting analytical queries, operational systems, machine learning workflows, or reporting tools, the product is shaped around repeatable consumption scenarios. Over time, usage insights and data usage analytics inform iteration and prioritisation.
It is not that organisations don’t have data or lack the commitment to it. The problem lies in stability in reusability.
To understand this, one should know that a data product is not defined by the volume it holds but by the standards that uphold it. It’s not the table but the guarantee around it, the ownership behind the definitions and its predictable behaviour under scale.
That’s the key to having a data product: it can be utilised without teams having to revalidate every assumption. And most importantly, there's an assurance across the data value chain that the direct impact and value of the data product can be tracked, evaluated, measured, and attributed, enabling an ability like never before to activate or deactivate data efforts and data resources strategically.
Following are the data product features than make this feasible at scale:
A data product without an intent or a purpose doesn’t serve any demonstrable value and is as valuable as an other asset.
Ranging from analytical insights to operational decisions and even downstream automation, a data product aligns its structure and freshness to align itself with serving a guarantee of a defined business outcome. Right-to-left engineering enables this by reverse engineering from the desired business outcome itself.
So, every aspect of the data product bundle, including its code, metadata, infrastructure resources, and data assets, and success of data contracts is directly aligned to a purpose.
A data product that is not easily accessible is as good as a data asset that doesn’t even exist.
To ensure discoverability and native accessibility, a data product must always be indexed in a searchable catalogue along with clear ownership, metadata, definitions and appropriate guidance on usage. And this is enabled through seamlessly through the depot construct (an infrastructure resource) that assigns unique universal address, allowing product calls or sub-asset calls from across the data ecosystem (internal or external sub-systems).
These depots are also policy-controlled at the granular level, automated through contract-triggers, and self-governed at scale. A data product should be consumable across environments, through stable interfaces, APIs, or query endpoints, without manual and unnecessary mediation.
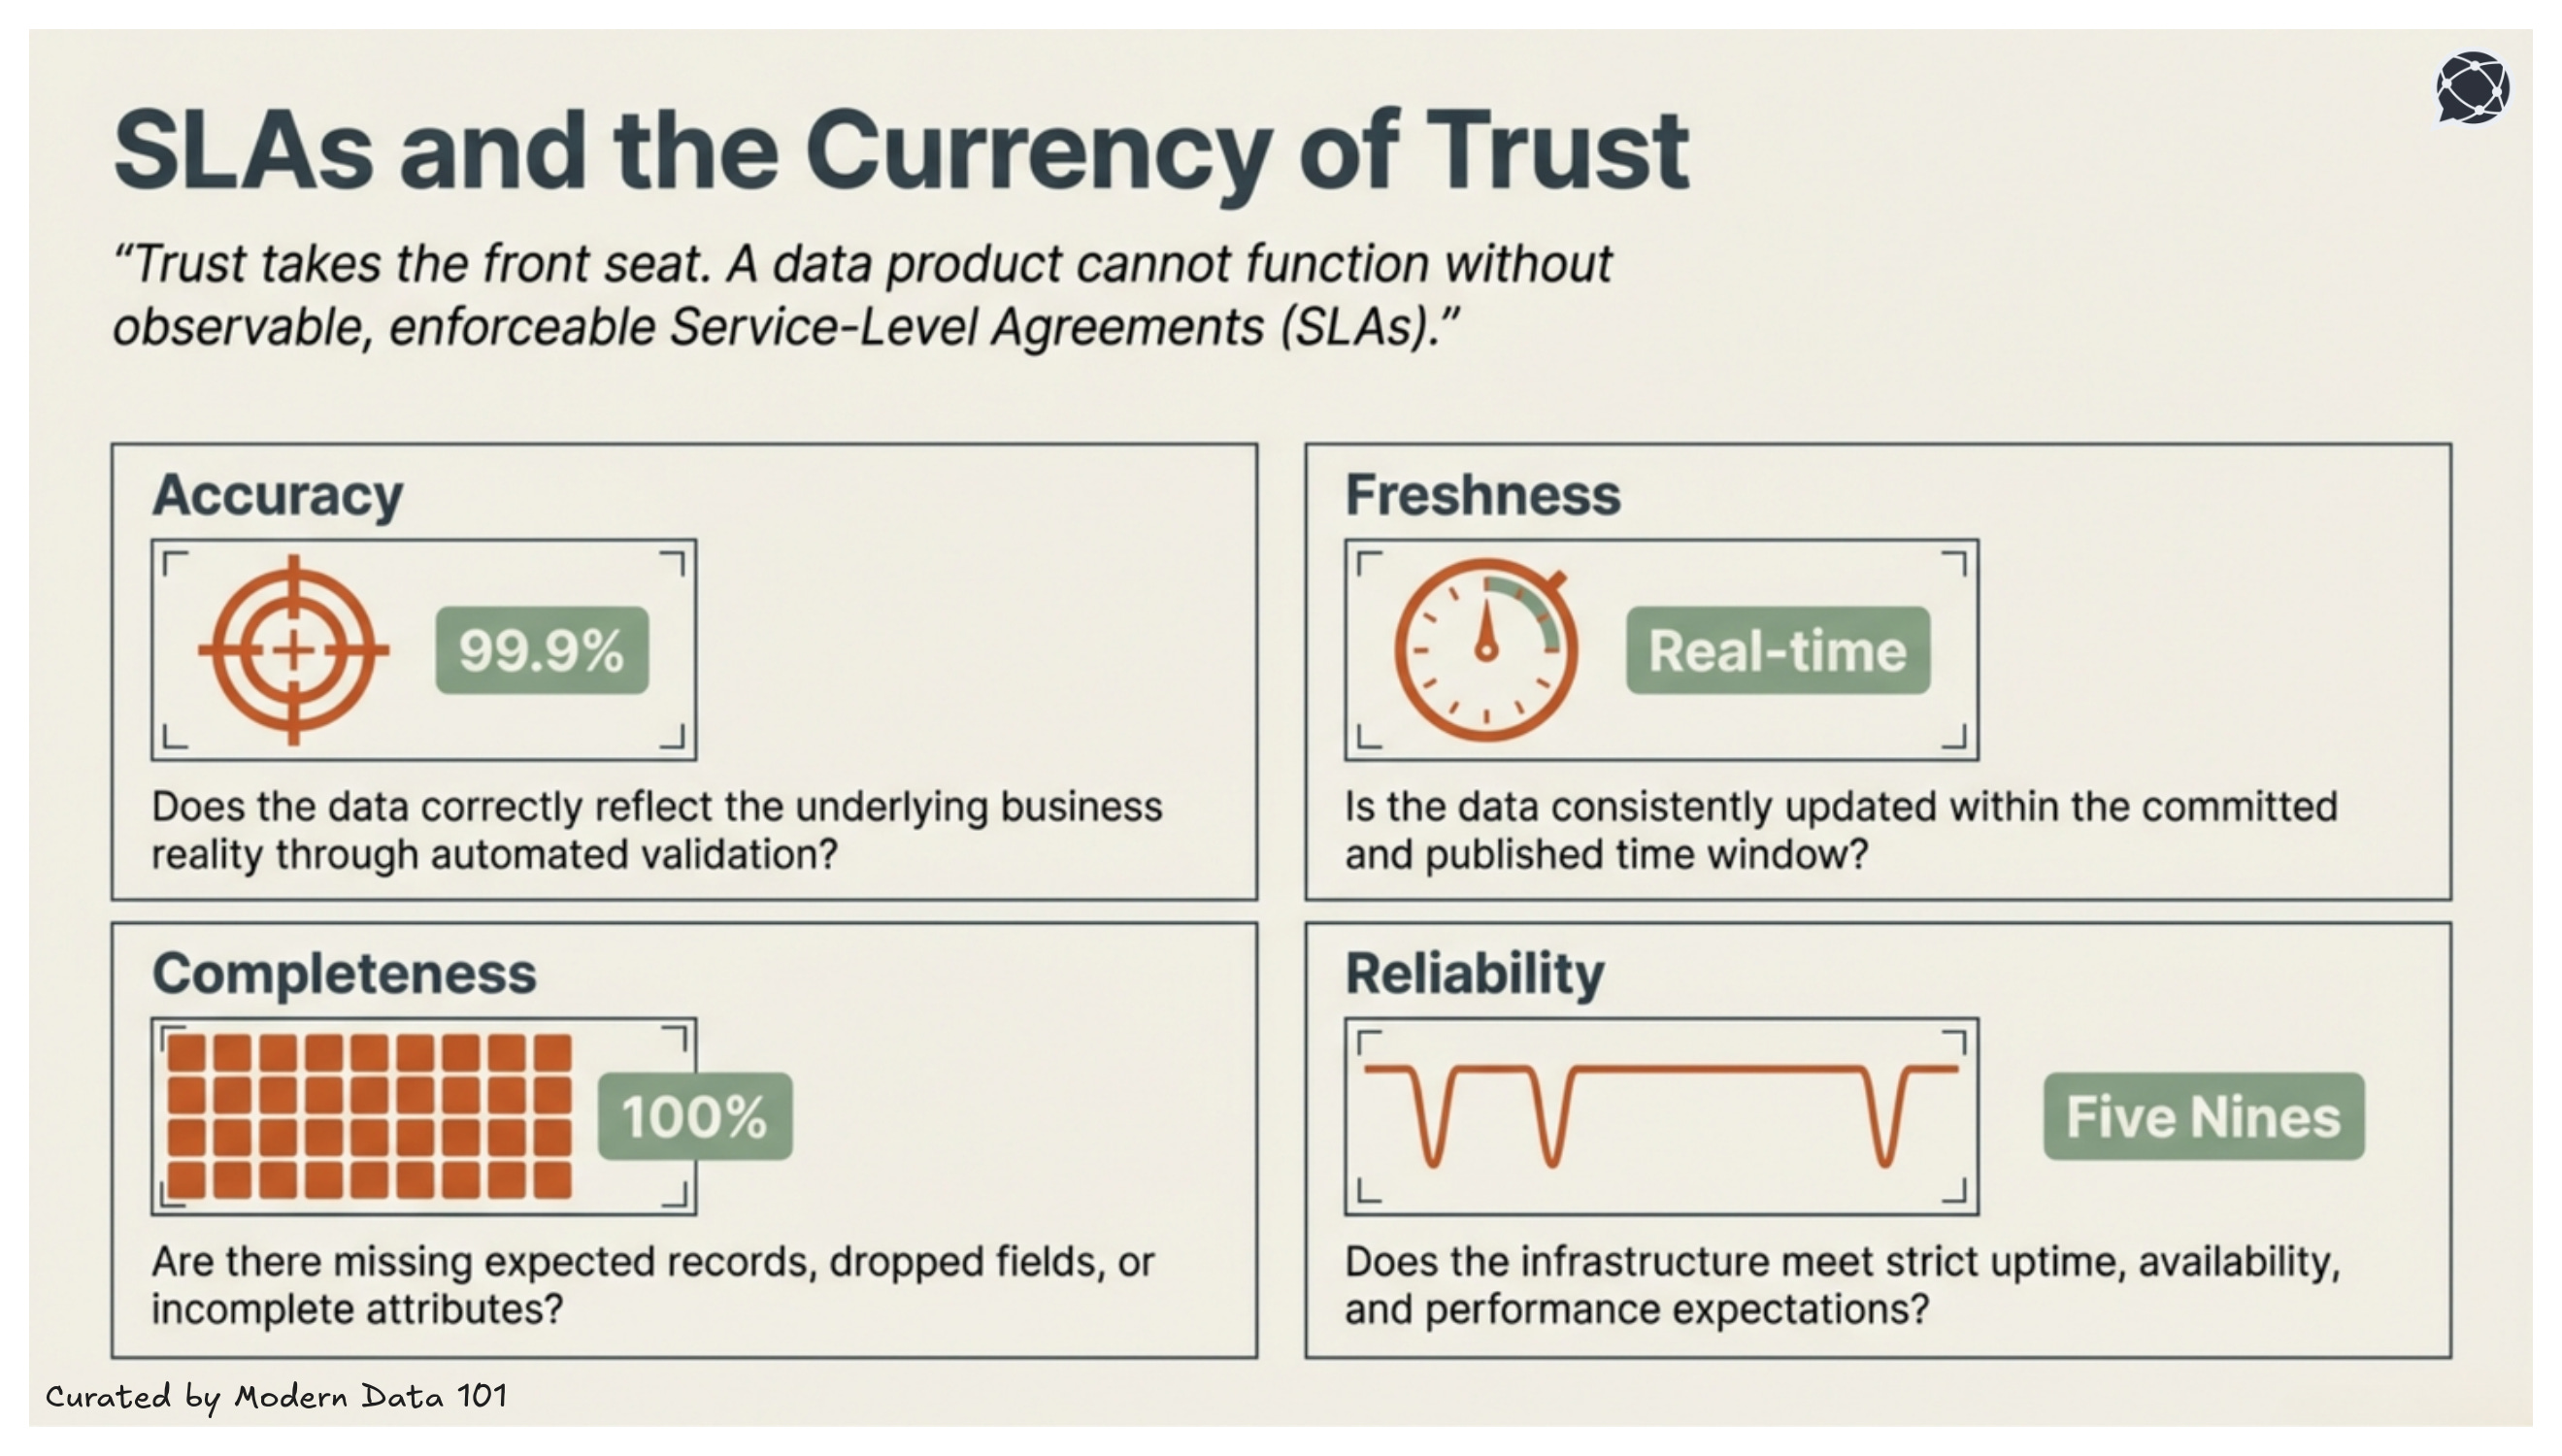
A data product must be observable through mechanisms that can guarantee its transparent quality signals and enforceable service expectations.
Just like with any business, trust takes the front seat, and a commitment to measurable outcomes is a basic expectation. A data product won’t pass data quality criteria involved in a service-level agreement (SLA), which is usually based on:
Embedded governance is a fundamental expectation of the current data stack. It is a mechanism that sustains governance and quality expectations at every interface of the data product.
Governance also consists of several factors like security controls, privacy safeguards and implementing policies. Meaning it is not a separate concern, but instead, something that contributes to access management and value-enablement.
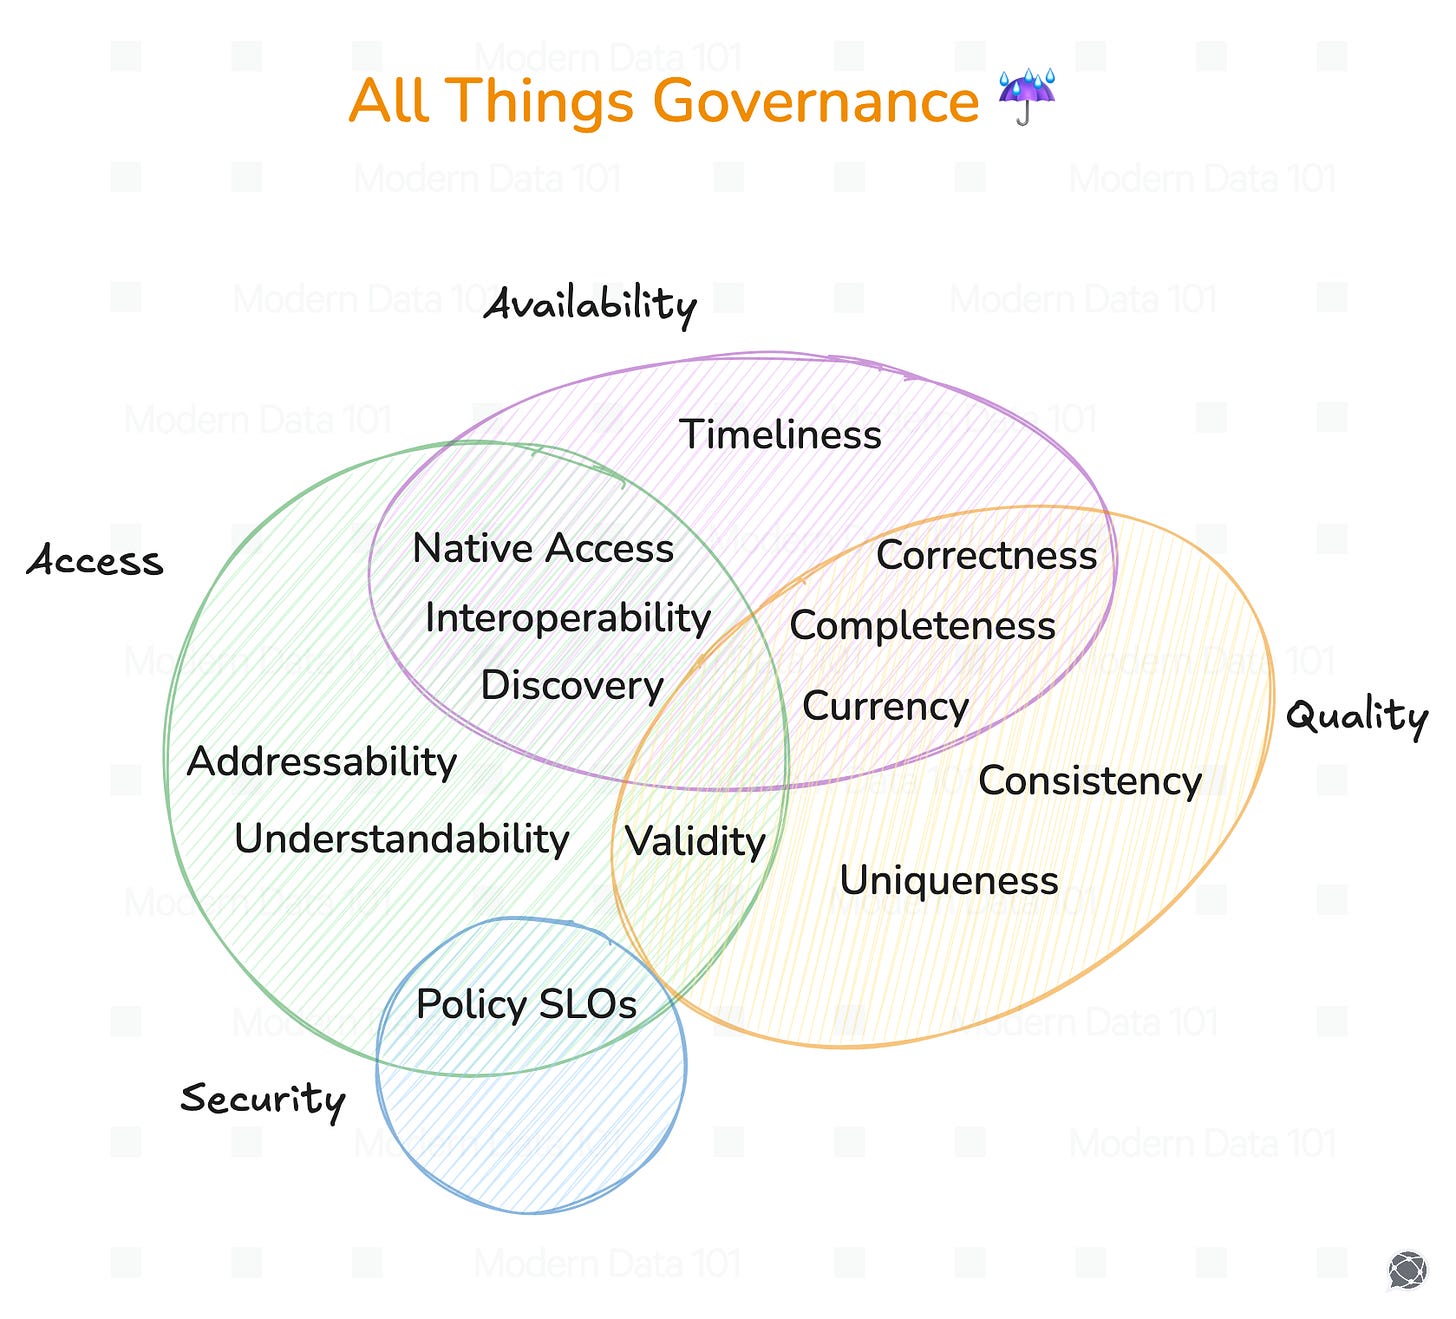
This makes a data product systematic, traceable, and aligned with regulatory and organisational constraints.
What majorly differentiates a dataset from a data product is its capability to be reused like a concrete product due to its stable definitions and consistent semantics. This allows consumers to use it widely without having to constantly worry about rebuilding transformations. Consider the value in reusing not just the data product, bust aspects of it as well including forking transformations, policy granules, and contract essentials (SLAs).
Additionally, this ensures compatibility across other data products along with other tools and domains. But it’s the reusability factor of a data product that prevents fragmentation and enables scale.
[related-9]
To prevent downstream consumers from unexpected shifts, change is required to be controlled to a certain degree while being transparent in nature. This is where structural and semantic updates come into the picture to put the user-first perspective in focus.
This leads to performance expectations being monitored, while cost implications are visible to ensure sustainable operation. Ideally, a product must remain stable, performant, and economically viable as adoption grows.
Since all data products are not created to serve the same purpose, utilising them interchangeably can lead to poor design decisions. So, a data product’s structure and scope are determined by the role it serves in the broader data value chain.
And this is why it is important to identify these distinctions to enable leaders and architects to design products that complement one another. This also ensures preventing competition, duplicated logic, and fragmentation.
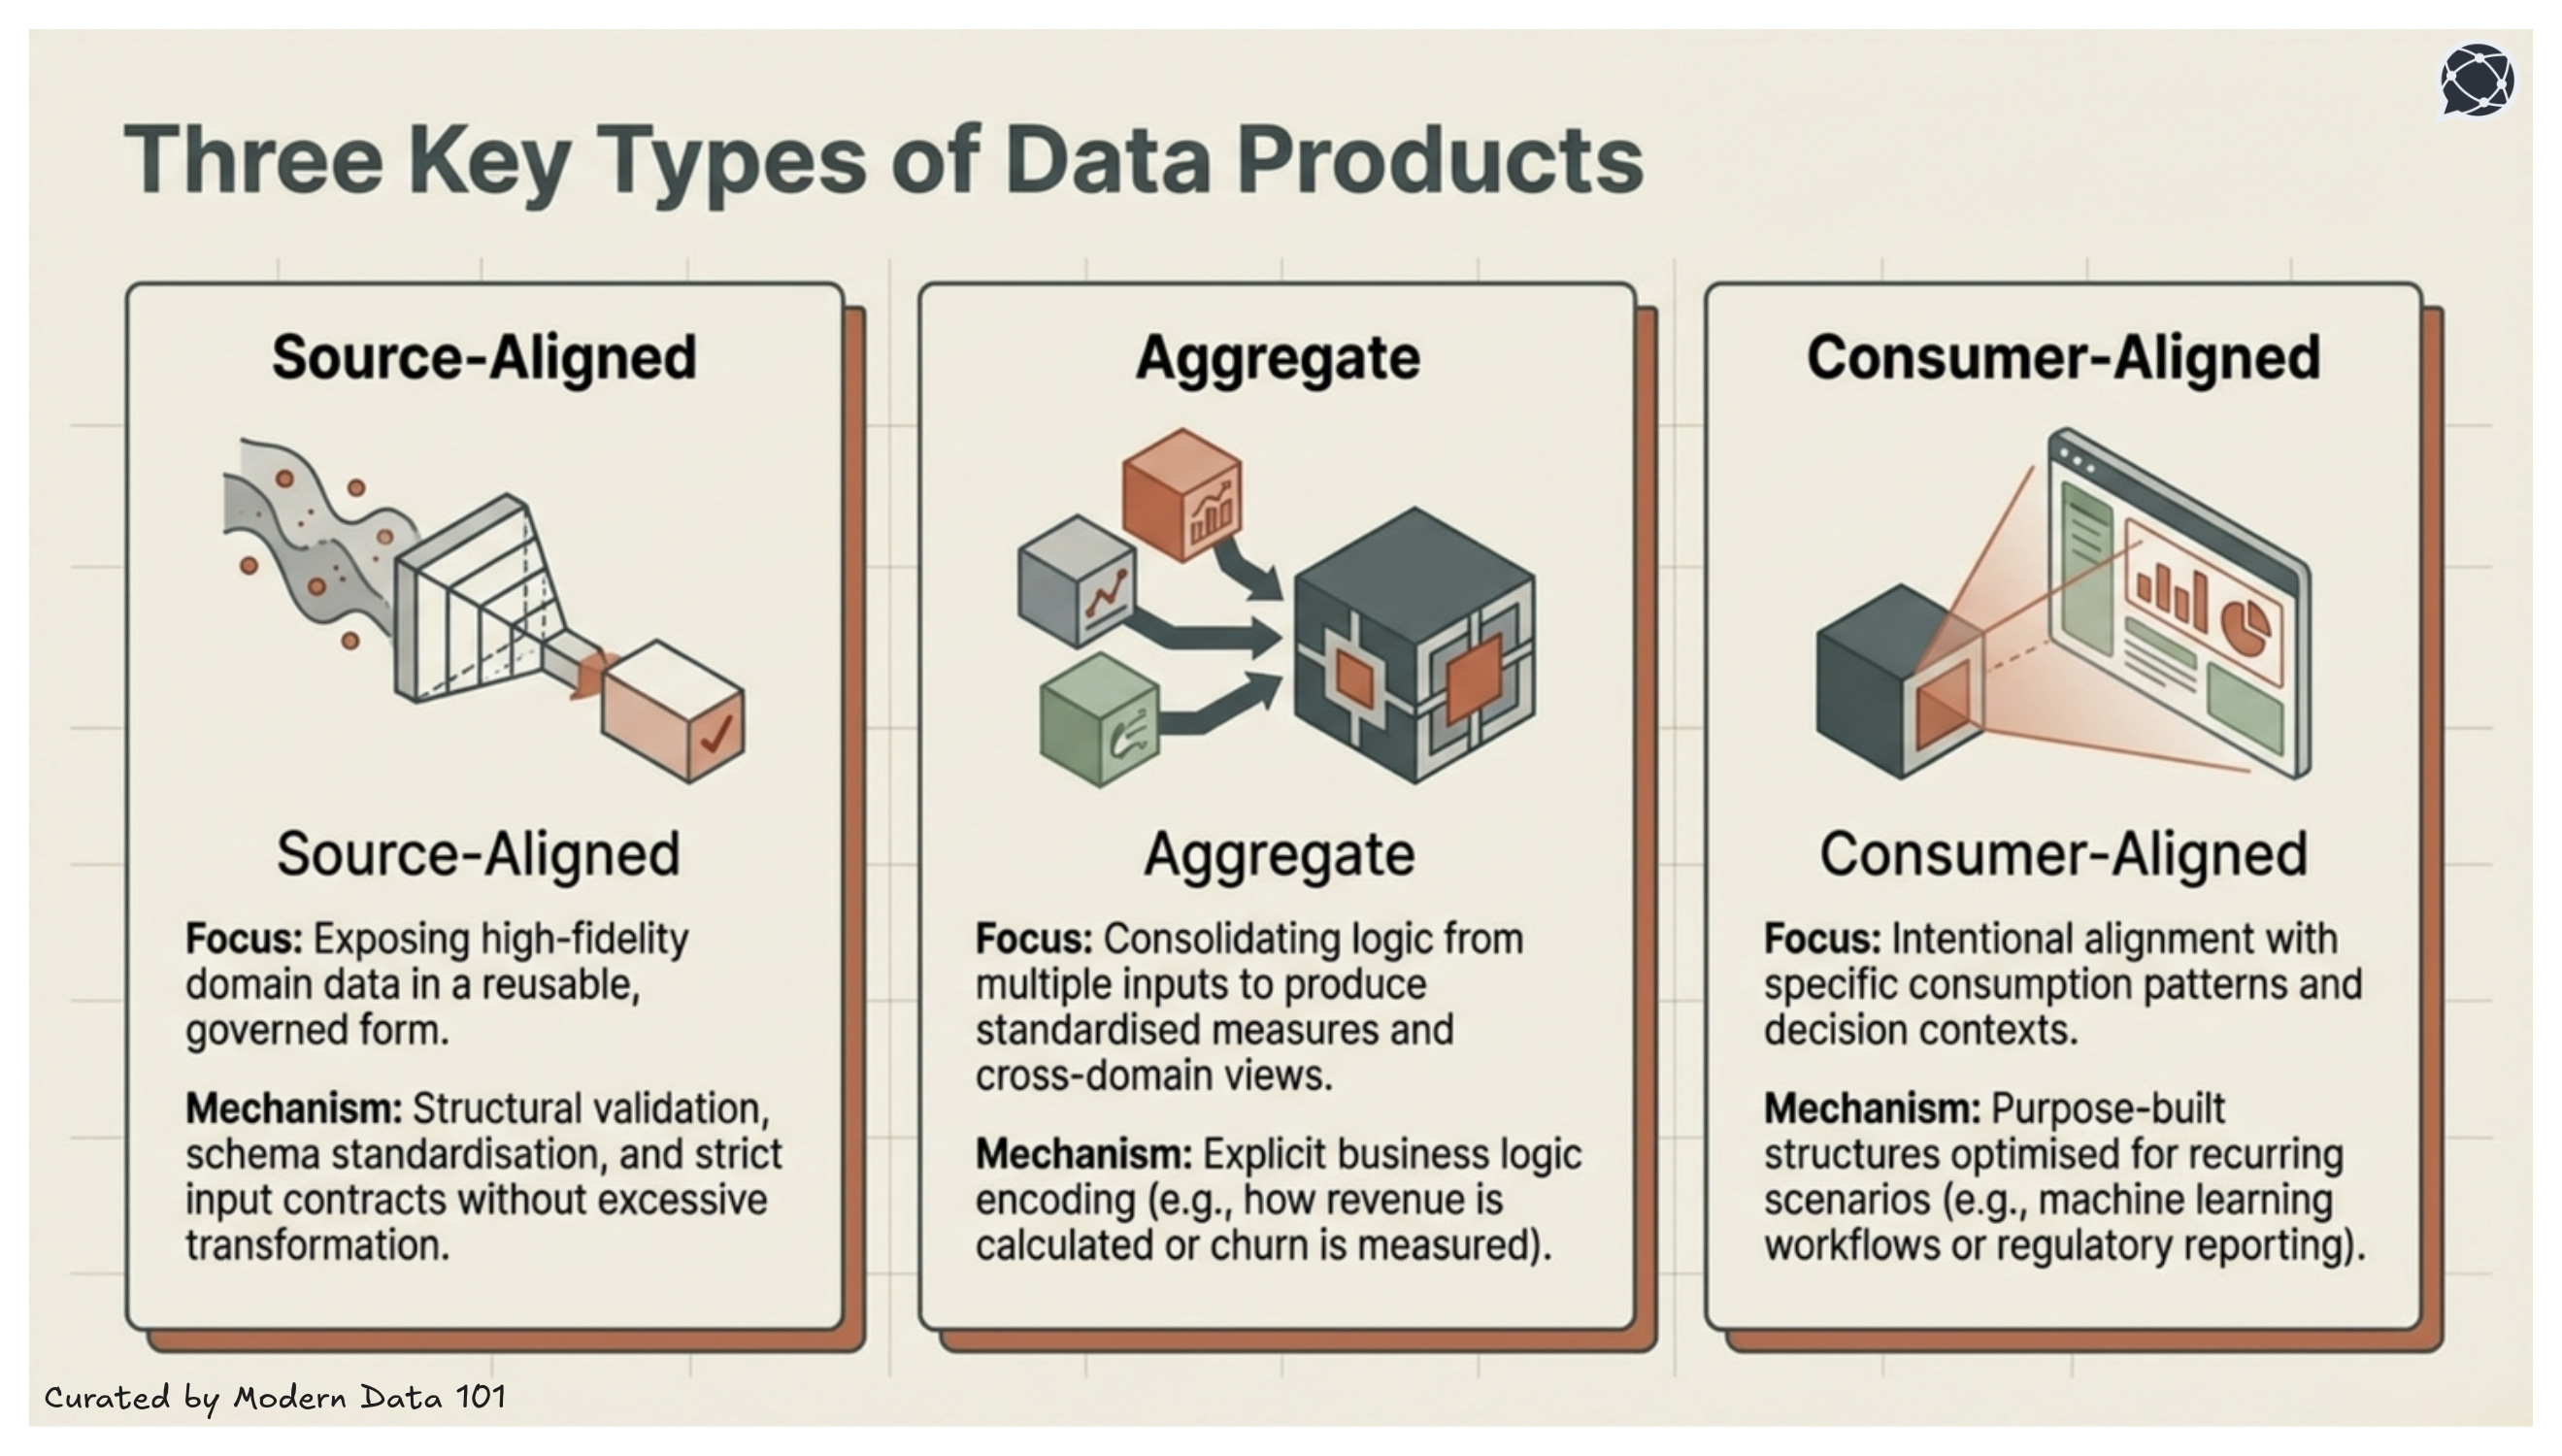
Source-aligned data products serve the primary purpose of exposing domain data in a reusable form that is also governed and structured, without any excessive transformation. It is the one that is closely aligned to operational systems.
Rather than deriving the value from aggregation or interpretation, these data products thrive on stability and reusability. This is achieved through preserving high-fidelity representations of business entities and applying structural validation, schema standardisation, and input contracts.
Aggregate data products consolidate logic from multiple inputs, which requires strong semantic discipline and clear quality thresholds. These data products not only operate at the insight layer but also combine multiple domain-aligned sources to produce standardised measures, derived entities, and cross-domain analytics views.
These data products encode business logic explicitly, defining how revenue is calculated, how churn is measured, or how performance indicators roll up across segments.
Due to their core characteristics, aggregate products’ reliability directly influences organisational trust in metrics. And these are often foundational to reporting, performance tracking, and strategic planning.
Consumer-aligned data products are designed around specific business use cases or decision contexts. Their defining characteristic is intentional alignment with defined consumption patterns, including latency expectations, access interfaces, and service guarantees.
These may support regulatory reporting, machine learning workflows, embedded analytics, or operational decision engines. Rather than reflecting a single source or domain boundary, they shape data into purpose-built structures optimised for recurring data consumption and usage scenarios.
While closer to business outcomes, they still rely on stable upstream source-aligned and aggregate products to maintain consistency.
[related-4]
The Data Product Lifecycle is the continuous process of capturing raw reality, shaping it into consumable forms for specific consumers (humans or machines), activating it in production, and evolving it based on how that consumption resolves uncertainty. In other words, the data product lifecycle preserves and shapes reality for different consumers over time.
The data product lifecycle has four stages, starting from design stage that sets the intent, develop stage that implements the data product specifications, and deploy stage that delivers the expectations to downstream consumers. In addition to this, it is the evolve stage that tests the above against real use cases, gathers feedback and incorporates it in the next design decision.
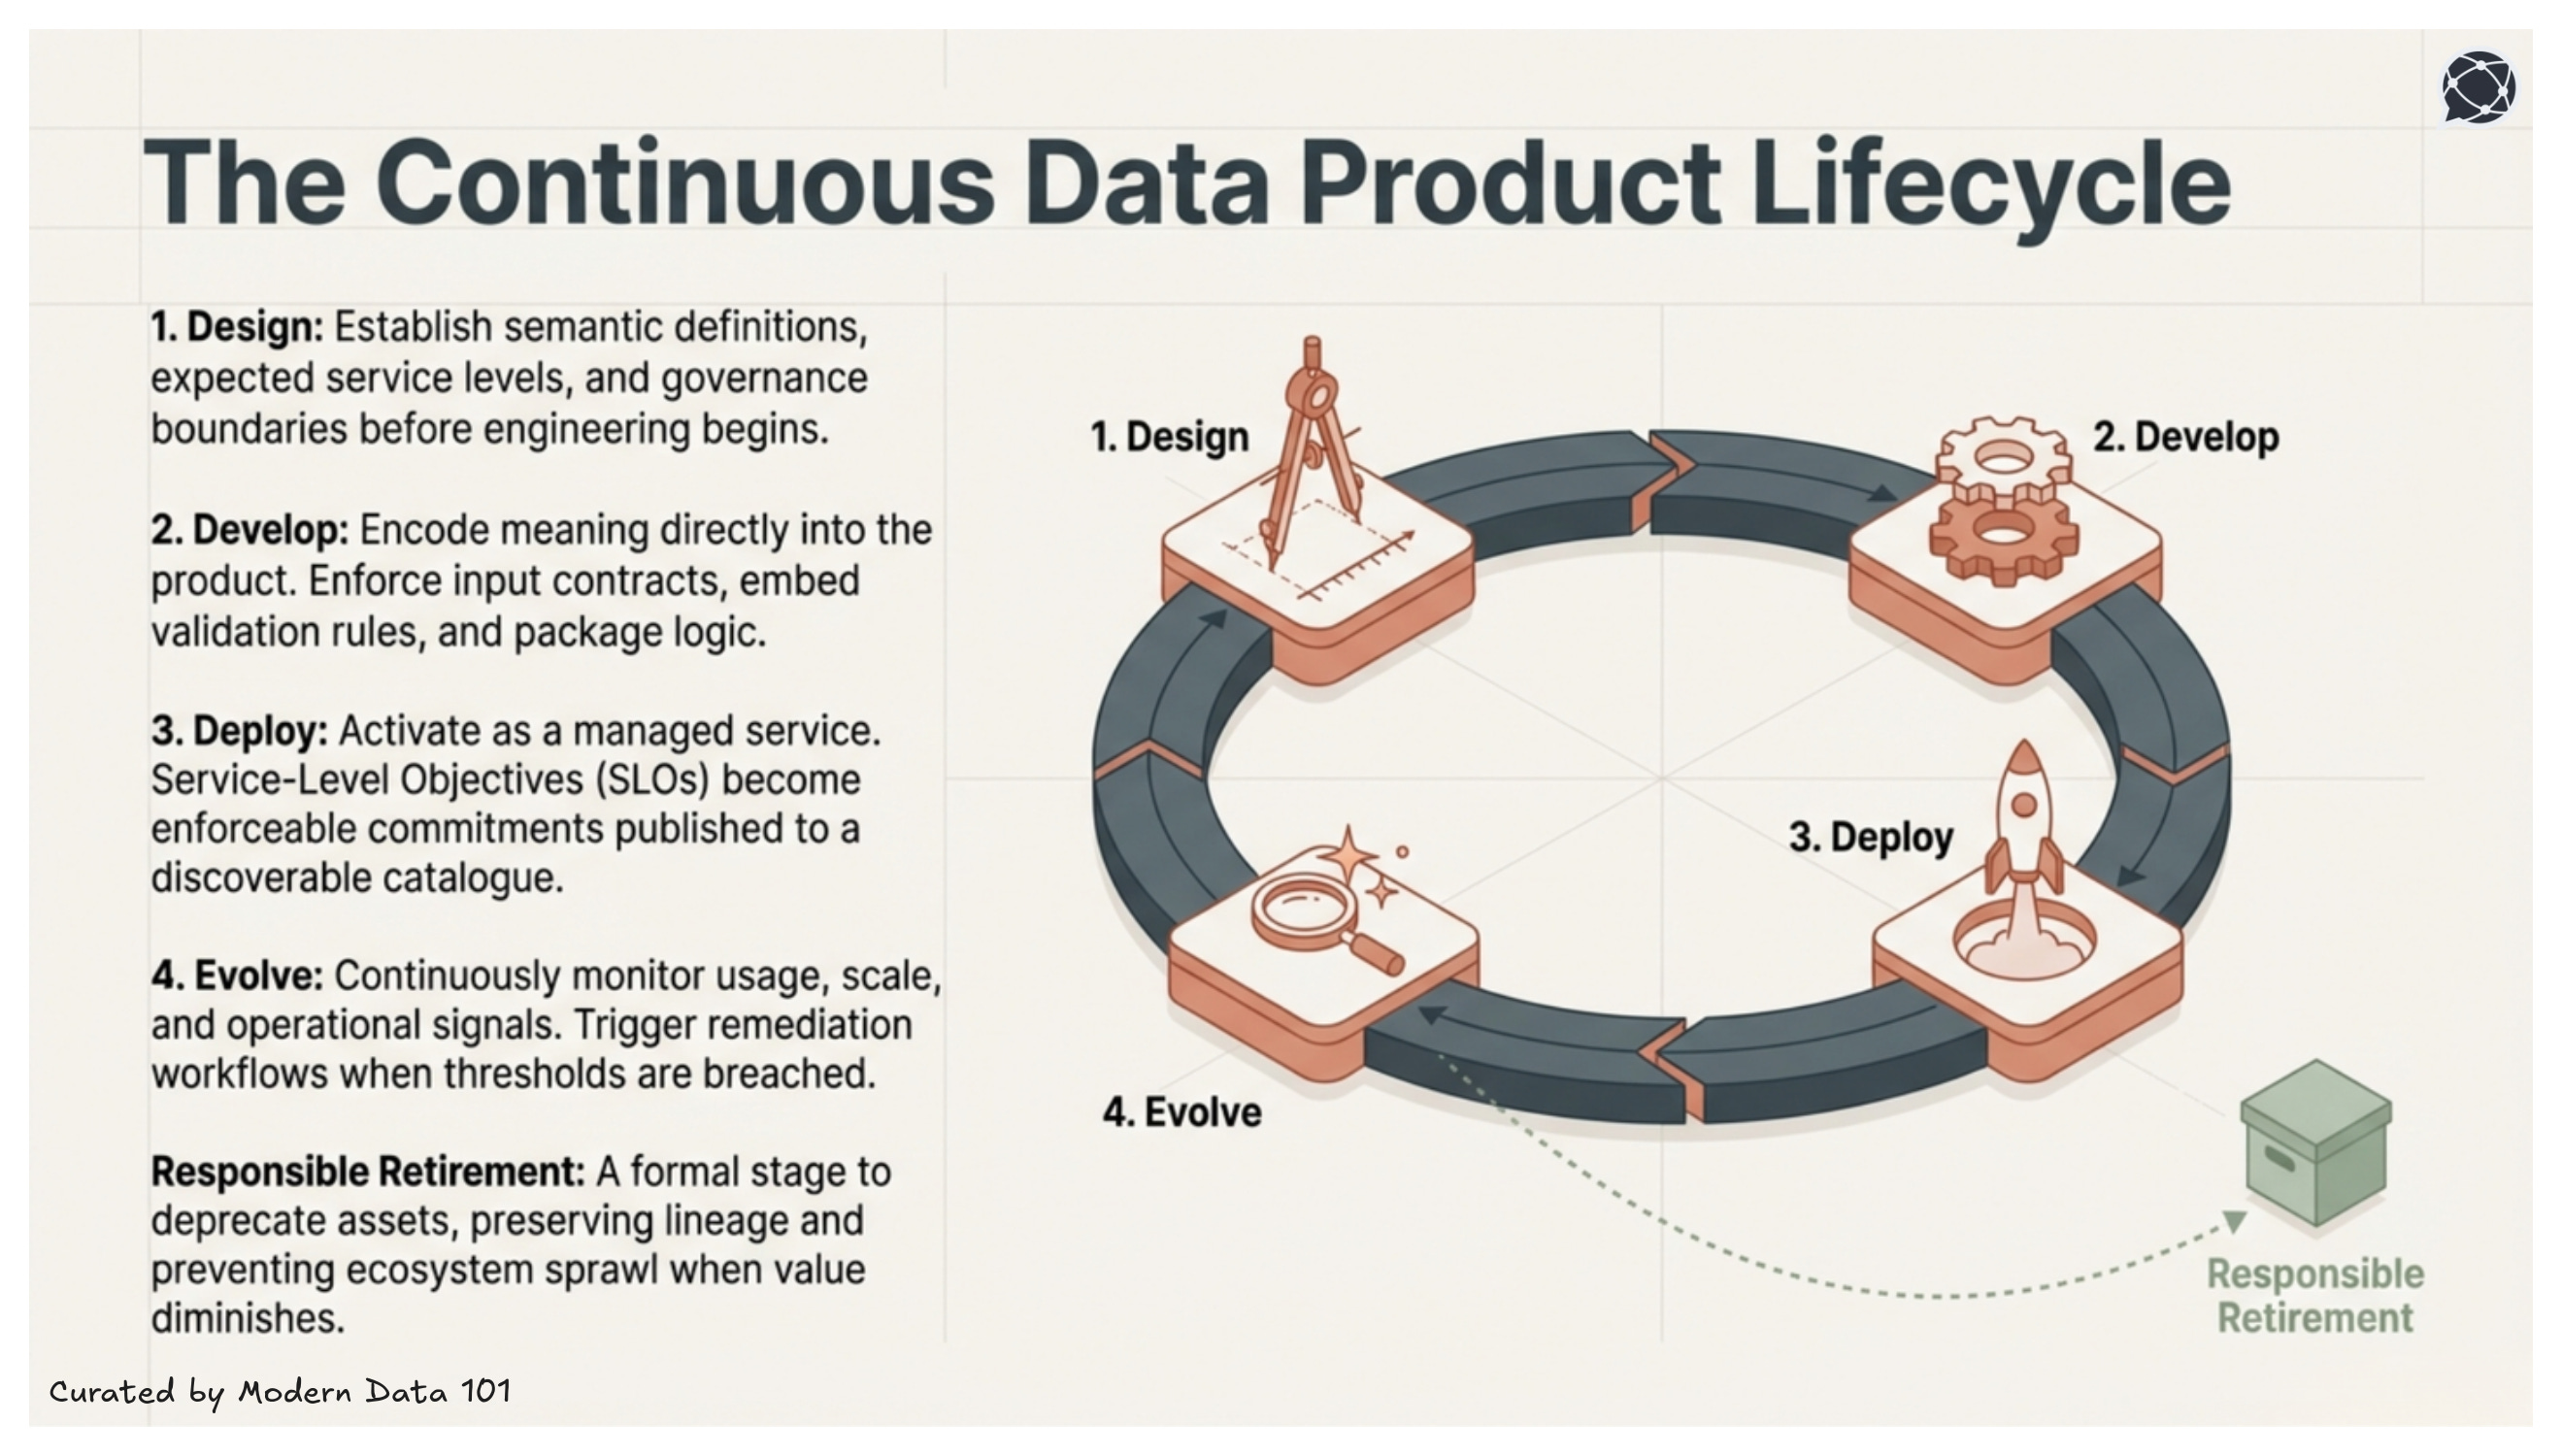
The design stage is the initial and most critical phase of the data product lifecycle, where the primary objective is to work backwards from a problem to identify consumers and their specific needs before any development begins.This stage is comprised of several key components:
[related-5]
The develop stage (Stage 2) of the data product lifecycle is the phase where data developers build the actual product based on the requirements and metrics established during the design stage. During this phase, business users primarily act as observers while developers integrate the technical stacks, data pipelines, and governance policies required to create a functional data product.
Key aspects of the development stage include:
The output of this is treated as a single entity to serve the purpose of product traceability, reproducibility, and consistent deployment across environments.
[related-6]
The deploy stage (Stage 3) is considered the "crux" of the data product lifecycle, primarily focused on providing an optimum developer experience. It shifts the focus from building individual components to launching a unified, functional data product through a self-serve platform that abstracts underlying infrastructure complexities.
Key components and processes of the deployment stage include:
[related-7]
The evolve stage (Stage 4) is the final, continuous phase of the data product lifecycle that acts as a bridge back to the initial design stage. Rather than being a linear endpoint, it is an iterative process focused on the "fitness" and optimisation of the data product to ensure long-term business value.
Key components and capabilities of the evolve stage include:
[related-8]
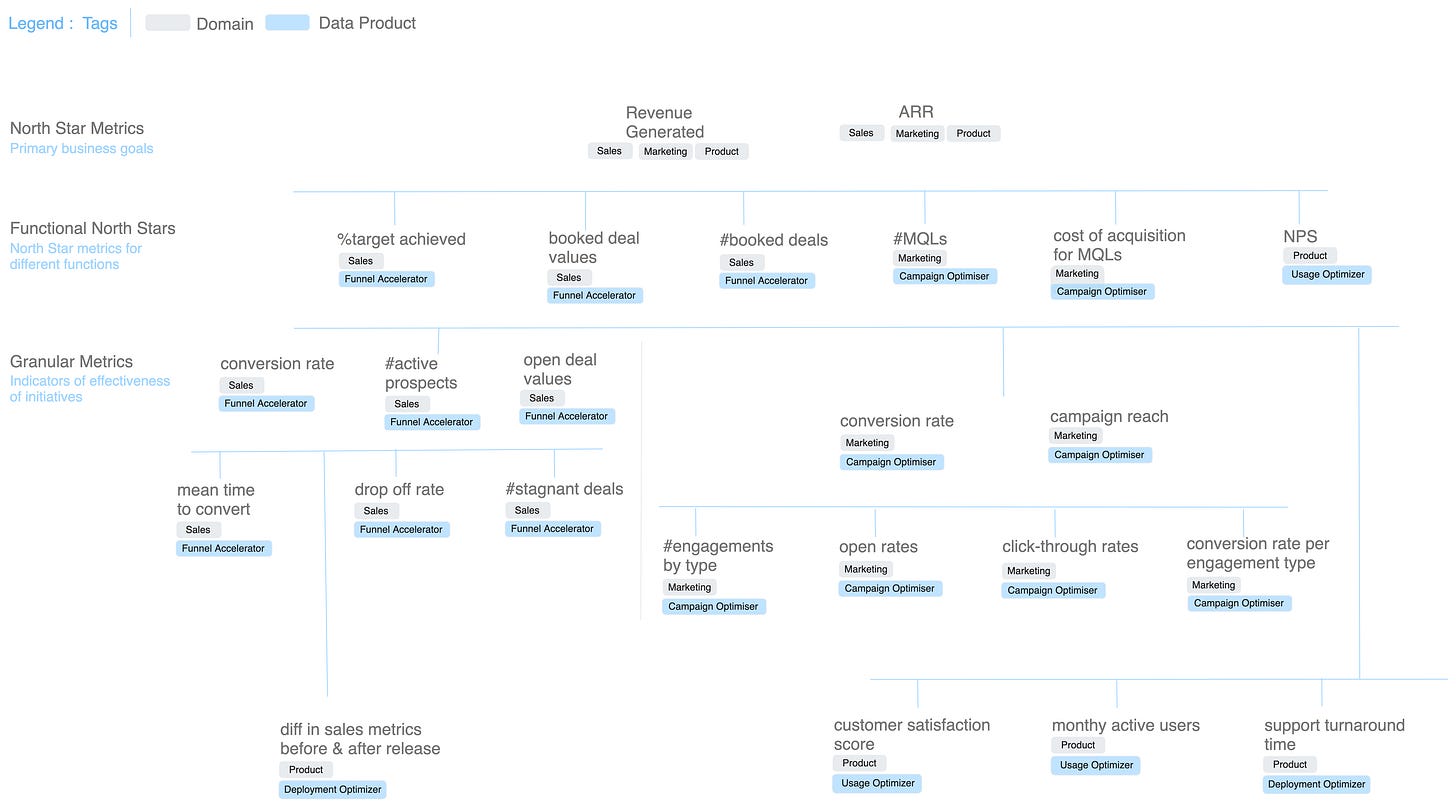
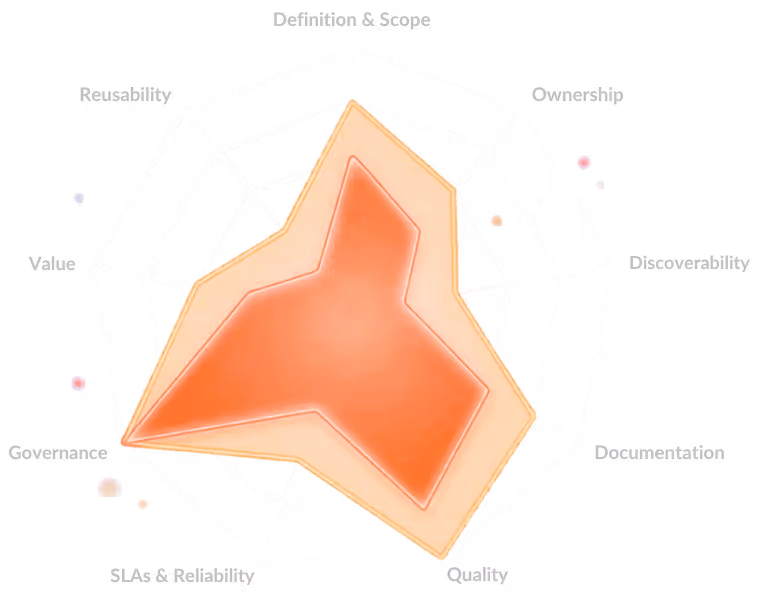
Value measurement is the key USP of data products, given how it enables a clear path to measure multiple aspects tied to one business goal in one bounded bundle.
Measurement matters more than portfolio size. Inventorying data products, classifying them by domain or business, and knowing their counts and distribution is a great start to managing a portfolio of data products, but measuring data products isn't just about tracking metrics. It's about driving and understanding value. A well-labelled shelf of unused products is still a losing strategy. Measurement closes the gap between existence and impact.
Many organisations struggle to measure effectiveness systematically. Countless dashboards and curated datasets exist in varying stages of maturity, use, and age. This is a direct consequence of treating data solutions as projects rather than products: projects optimise deadlines while products optimise ongoing outcomes.
Products optimise ongoing outcomes, which are measured by adoption, quality, and business impact. It starts with understanding why the data exists and who it serves, then defines quality, usability, and success metrics upfront. Without this shift in orientation, no measurement framework will hold. You'll always be measuring outputs, never outcomes. See DORA metrics for a comparable product-health orientation from the software engineering world.
A data product adheres to rigorous quality assurance processes and data governance principles. It ensures that data is accurate, reliable, and transparently sourced, instilling trust and confidence in the insights or outputs it provides.
Trust is the precondition for all downstream measurement: adoption, ROI, and business impact metrics are meaningless if the data itself is suspect.
Quantitative measures:
Qualitative measures:
By dedicatedly focusing on broader user adoption as the primary North Star of platform engineering teams, platforms evolve into being more user-friendly, with more intuitive features that deliver embedded experiences.
The same logic applies at the product level: adoption isn't a vanity metric, it's the primary signal that a product is solving a real problem.
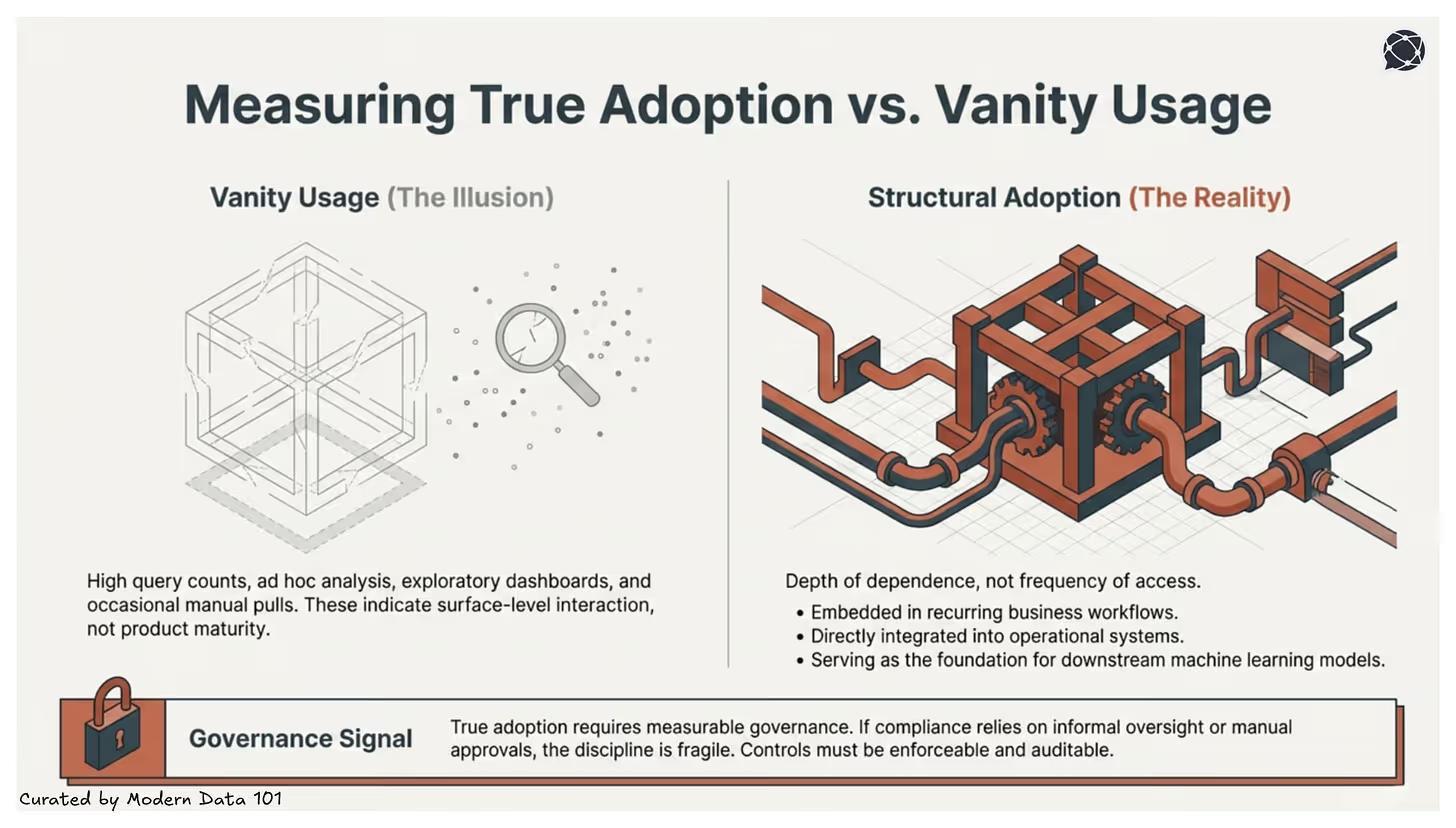
Quantitative measures:
Qualitative measures:
Teams iterate and monitor over time, treating data products as dynamic entities with owners, service level objectives (SLOs), and feedback loops. This mindset introduces ownership, governance, and continuous improvement, ensuring data becomes a durable, evolving business entity rather than a one-time deliverable.
Quantitative measures:
Qualitative measures:
A Metric Tree is a hierarchy of numbers which expresses how a business creates value. It starts with a North Star metric and decomposes it into its components and controllable levers. This structure turns business performance into a navigable system.
Analysts stop chasing disconnected KPIs and start reasoning through dependencies. Metric Trees expose causality: where an improvement will actually matter and how interventions cascade through the business.
A great ROI measurement framework should account for both tangible and intangible value. Data products are never responsible for creating direct revenue. What they do is enable operational efficiency, reduce risks, and increase the trust quotient of gathered insights, contributing to business value in the long run. Treating data product ROI as a direct revenue attribution exercise will always disappoint.
Three measurement models:
Outcome-driven KPIs that move the needle:
Retirement criteria matter as much as launch criteria; without them, you get data product sprawl. See resources on data product governance for enterprise-scale portfolio management patterns.
A well-designed data product supports multiple business use cases without losing integrity because it is built around a semantic model and a metric dependency tree, not around any single consumer's needs.
Business logic is defined once and reused everywhere: dashboards, notebooks, and applications all speak the same analytical language without redefining logic downstream. One definition of "Revenue," instead of three. This is what makes cross-domain reuse structurally safe rather than structurally fragile.
A data product is able to furnish multiple output ports based on the user's requirements: Experience Ports that serve a wide band of demands without any additional processing or transformation effort, ejecting the same data through different channels: HTTP, GraphQL, Postgres, Data APIs, LLM interfaces, and more.
Each new consumer draws from the same governed core; they just access it through a different door. Beneath that, data contracts instil trust in the underlying data product and encourage a "build once, use many times" model: codified SLOs governing quality, semantics, and schema across every exchange point, so a change caught at the contract level doesn't silently cascade into every downstream pipeline.
And because reusability is built in before modelling even begins through lineage graphs, metadata graphs, and a marketplace scan for existing templates that can be forked and customised, the product starts composable and stays that way, accumulating use cases as a feature rather than absorbing them as an unplanned liability.
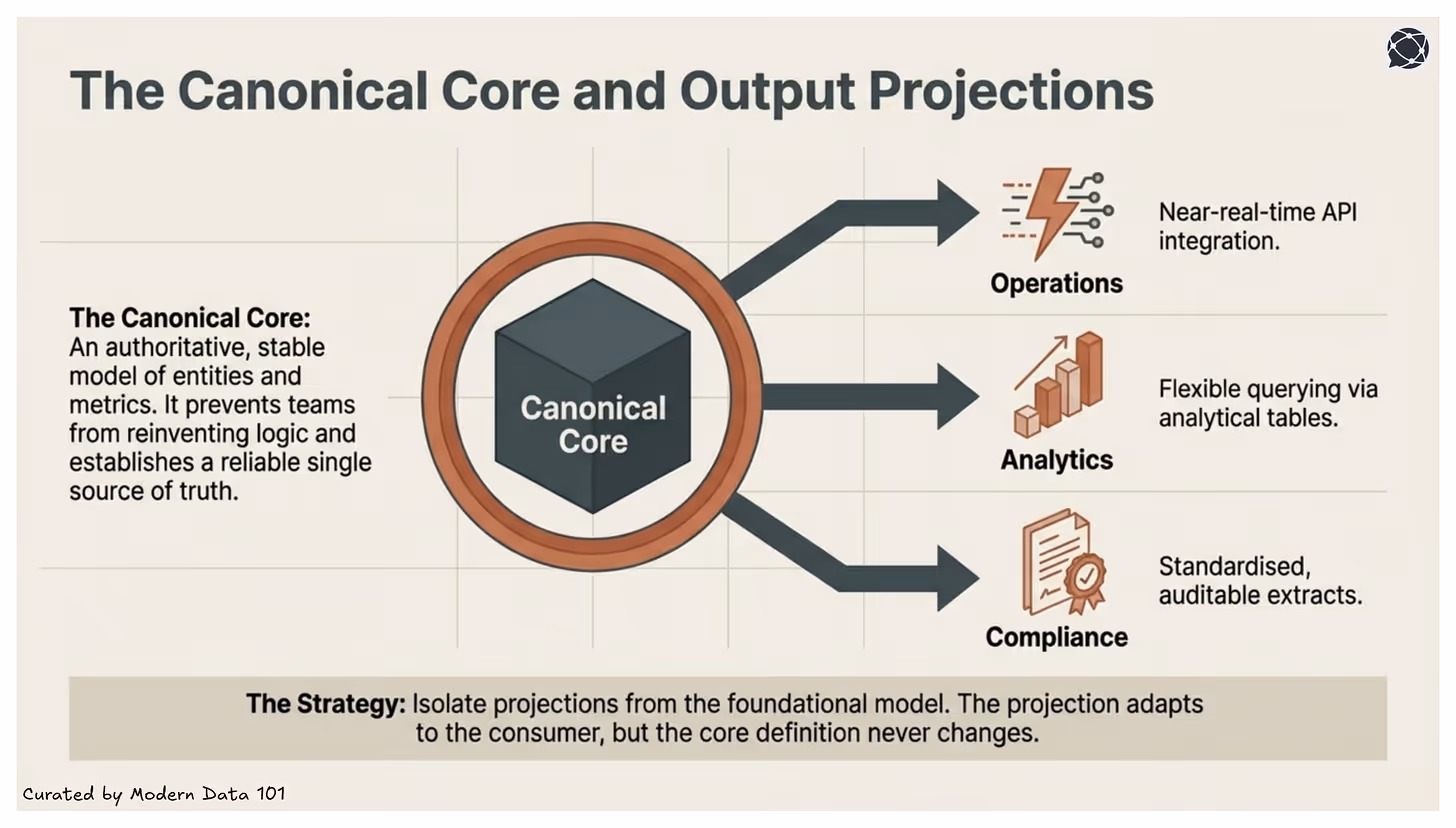
An authoritative and stable model is the centre of a well-designed data product, which consists of entities, metrics, and relationships and governs them deliberately.
This presents controlled changes and not reactive ones, which are also not distorted from a use-case-specific sense but instead are semantically consistent, versioned, and protected in nature. This also leads to deriving all downstream views. This is the core that creates structural reuse and also prevents teams from reinventing logic by reducing the semantic drift and establishing a reliable single source of truth.
Well-built and well-defined output ports become fundamental when we are enquiring about a data product’s maturity because different teams consume data differently:
But a mature data product has a smarter way to deal with this. It exposes multiple output ports such as SQL views, APIs, data shares, streaming endpoints, or derived analytical tables, while keeping the foundational logic centralised.
This architectural separation allows one product to serve many contexts without sacrificing consistency. Here, only the projection changes, but the definition does not.
The infrastructure and the core of a data product make a huge difference because, when built cautiously, they can lead to serving multiple decision layers simultaneously. It’s the alignment that is capable of replacing reconciliation and the trust that substitutes debate.
Check out: The Data Product Marketplace: A Single Interface for Business
For example:
By deriving each of these from the same canonical core, the organisation ensures that every decision context relies on identical foundational definitions.
As adoption grows, pressure follows. New teams request customisations, edge cases multiply, and without discipline, the canonical core begins to bend toward individual demands. Over time, this results in duplicated transformations and semantic drift. A mature data product prevents this by isolating projections from the foundational model, keeping use-case logic modular while the core remains stable and governed.
Protecting the core is not rigidity. It is what makes durable reuse, composability, and long-term trust possible.
Knowing what a data product is and knowing how to actually build and deploy one are two different organisational capabilities, and the gap between them is where most implementations break down.
Companies haven't figured out the right delivery operating model. Their waterfall process doesn't fit business needs, and shouting agile without implementing it properly doesn't work. Moreover, most traditional data stacks lack the foundational elements required to construct data products on top.
Practical implementation, then, isn't primarily a technology question. They are operational questions:
The Data Product 101 module frames this as a sequential journey through Design, Develop, Deploy, and Evolve, and the key insight is that the design stage carries the most weight. Organisations that skip it tend to build technically functional products that nobody adopts, because the product was designed around data availability rather than user need.
What separates implementations that compound in value from ones that decay is the discipline of working backwards from the business problem before touching the data. A product approach means identifying the consumer and their problems before kickstarting any effort: mapping all data efforts to specific business goals, metrics, and challenges.
The first and most critical stage is thorough market research: finding out the validity of your data in your consumer market, surfacing the users and personas the data product can optimally serve, and then mapping out their pain points across the user journey. From that foundation, a metric model is drafted (a stable map from granular sub-metrics up to North Star business goals) before the semantic model and physical data mapping begin.
This sequencing is what determines whether a data product accumulates use cases as an asset or accumulates technical debt as a liability. Research on product-led organisations from Harvard Business School consistently shows that organisations anchoring products to measurable user outcomes before building, sustain higher adoption and longer product lifespans, and data products are no exception.
Below are a few implementation examples that should illustrate the journey from a 10k feet view:
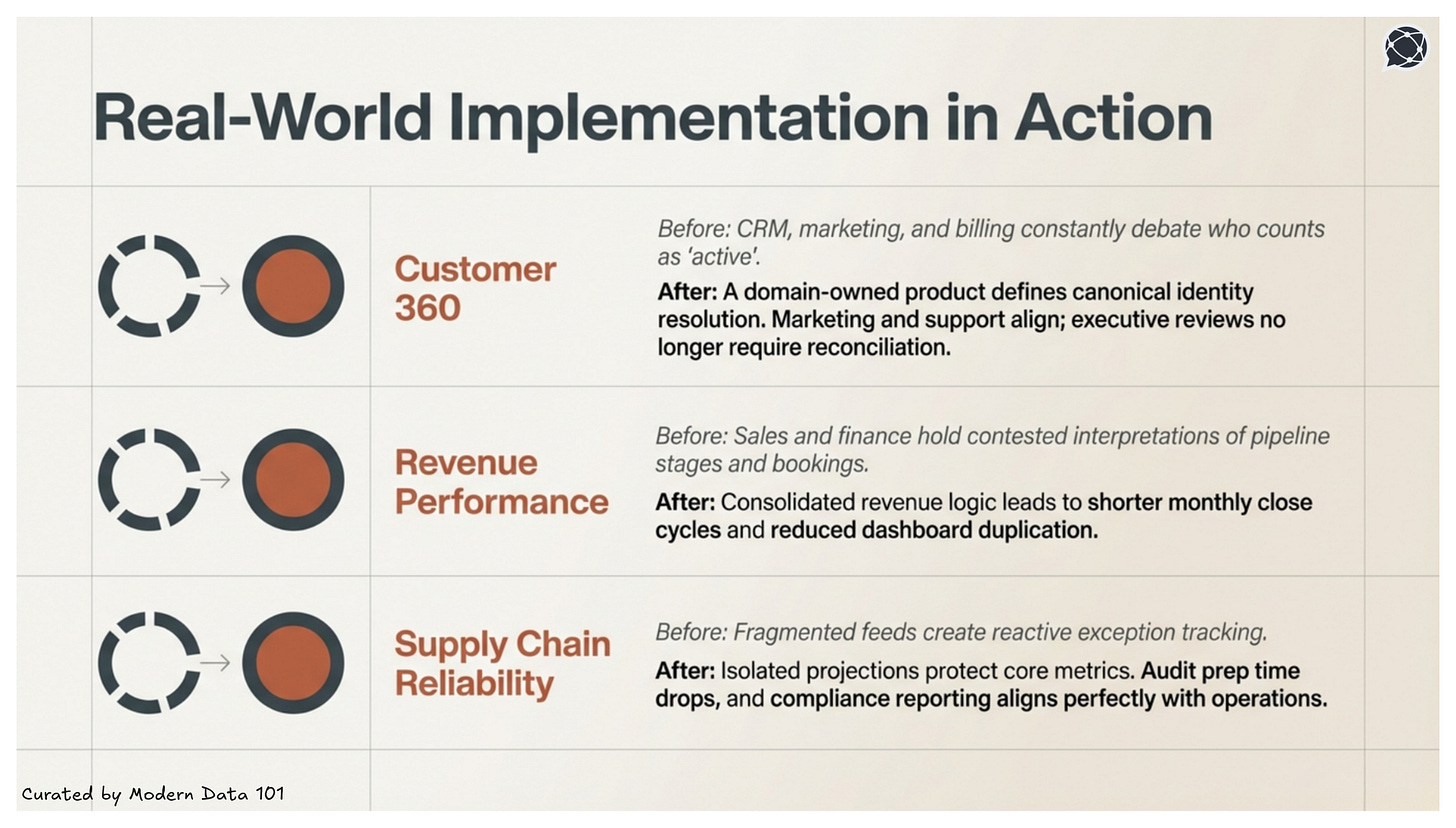
The core implementation challenge for a Customer 360 Data Product isn't getting the data, but it's resolving definitional conflicts across the domains that own it. Before any source is connected, align on what the product must answer: what counts as an "active customer," how "lifetime value" is calculated, and which system holds the authoritative customer ID.
Step 1: Design the semantic model first
Step 2: Build source-aligned products as foundations
Step 3: Enable reuse through templatisation
Step 4: Enforce governance at the product layer, not the consumer layer
The core implementation challenge for a Revenue Optimisation Data Product is connecting operational metrics to financial outcomes in a way that every function, including Sales, Marketing, and Finance, trusts and can act on from the same source.
Step 1: Define the North Star before defining the data
Step 2: Build the logical model around business entities, not source tables
Step 3: Enable cross-functional reuse from a single semantic layer
Step 4: Bridge existing tooling into the data product construct
The core implementation challenge for a supply chain management data product is that data arrives from dozens of source systems (ERP, WMS, supplier portals, logistics APIs) with strict freshness requirements, where latency directly translates to cost.
Step 1: Build source-aligned products per entity before building anything consumer-facing
Step 2: Set SLOs that reflect operational reality, not engineering convention
Step 3: Automate quality enforcement across all dimensions
Step 4: Feed operational metrics back into product evolution
A data product lifecycle doesn't sustain itself through tooling or architecture alone. To execute the data product lifecycle effectively, it needs dedicated teams and, crucially, very clear roles with well-defined responsibilities.
When roles blur, accountability collapses: projects miss their mark, definitions drift, and what looked promising on a roadmap fails in production. The roles below constitute the full operating model for any organisation serious about data products as long-term business assets.
The Data Product Manager is the strategic brain and ultimate champion of the data product's vision: the CEO of their specific data product domain, charting the course for its success in the vast ocean of business needs. Their orientation is always outward and forward: market fit, business alignment, and long-term relevance.
Core responsibilities:
If the DPM is the visionary architect mapping out the grand design, the Data Product Owner is the chief builder on the construction site. Their core mission is crystal clear: to bring the set strategic vision to life as tangible, working data products. Their orientation is inward and immediate: the sprint, the backlog, the build.
Core responsibilities:
Neither role can truly succeed in isolation. Their collaboration is the heartbeat of successful data product development, each leading at different moments, but always moving toward a shared destination: a data product that delivers undeniable value and delights its users.
Learn more on how these two roles collaborate in this detailed guide here ↗️
These two roles form the core execution layer beneath the DPO, where business intent gets translated into a stable, production-grade data infrastructure.
Platform engineers provide the standardised automation, access controls, and observability infrastructure that domain teams rely on to operate autonomously. Their contribution is most leveraged when the organisation runs on a Data Developer Platform: a standard that abstracts infrastructure complexity so data product teams can focus on outcomes rather than plumbing. Scalability, security, and compliance are designed into the foundation, not bolted on after the first incident.
Data scientists and ML engineers are primary consumers of data products through stable, governed interfaces. Their role in the operating model is to extend products responsibly (building models, features, and downstream applications on top of governed foundations)without destabilising the core product that other consumers depend on. The stability guarantee from the DPO and engineering layer is what makes this extension safe at scale.
Governance and risk functions ensure that regulatory obligations, traceability, and auditability are structurally embedded into the product rather than manually policed after the fact. In practice, this means data contracts, attribute-based access controls, and lineage documentation are requirements the product must satisfy before deployment.
Business and domain leads validate that the definitions encoded in the semantic model reflect how the business actually operates, not how data engineers assume it does. Their involvement at the design stage, and their ongoing attestation of metric accuracy, is what prevents the most common form of data product failure: a technically correct product that answers questions nobody is actually asking.
Executive sponsors provide the organisational mandate, funding continuity, and strategic air cover that allow data products to be treated as long-term infrastructure rather than expiring projects.
Getting the distinction between data product roles right isn't just about drawing organisational charts or arguing over titles: it's vital for building truly useful, impactful data products that genuinely move the needle for the business, and for fostering smoother, more efficient, and ultimately happier data teams.
Without executive sponsorship, reinforcing that framing, even well-designed products get deprioritised the moment a quarterly target shifts.
Modern Data 101 is a movement redefining how the world thinks about data. A community built by the same team behind the world’s first data operating system, Modern Data 101 sits at the intersection of data, product thinking, and AI. Spread across 150+ countries, the community brings together a global network of practitioners, architects, and leaders who are actively building the next generation of data systems.
At its core, Modern Data 101 exists to simplify the journey from raw data to tangible and observable impact. It advocates high-potential data systems and next-gen architectures to unify and activate insights and automation across analytics, applications, and operational workflows at the edge.
In a world shifting from data stacks to AI ecosystems, Modern Data 101 helps teams not just navigate the change but lead it.
Your Copy of the Modern Data Survey Report
Better decisions start with shared insight.
Pass it along to your team →
Your Copy of the Modern Data Survey Report
Better decisions start with shared insight.
Pass it along to your team →


Find more community resources
Modern Data 101 is a movement redefining how the world thinks about data. A community built by the same team behind the world’s first data operating system, Modern Data 101 sits at the intersection of data, product thinking, and AI. Spread across 150+ countries, the community brings together a global network of practitioners, architects, and leaders who are actively building the next generation of data systems.
At its core, Modern Data 101 exists to simplify the journey from raw data to tangible and observable impact. It advocates high-potential data systems and next-gen architectures to unify and activate insights and automation across analytics, applications, and operational workflows at the edge.
In a world shifting from data stacks to AI ecosystems, Modern Data 101 helps teams not just navigate the change but lead it.

Find all things data products, be it strategy, implementation, or a directory of top data product experts & their insights to learn from.
Connect with the minds shaping the future of data. Modern Data 101 is your gateway to share ideas and build relationships that drive innovation.
Showcase your expertise and stand out in a community of like-minded professionals. Share your journey, insights, and solutions with peers and industry leaders.

.avif "Brij Mohan Singh")


