

Access full report
Oops! Something went wrong while submitting the form.

🤍

Facilitated by The Modern Data Company in collaboration with the Modern Data 101 Community
Latest reads...


%20(1).png)
TABLE OF CONTENT


.avif)

Optimising business decisions is by far one of the most crucial yet hard-to-achieve goals for many organisations. It was through business analytics and business intelligence solutions that this could become a lot more actionable, insightful and easy to produce element across business operations.
Business intelligence software, like platforms, is often central to turning raw data into insight. But with rising complexity, volume, AI potential, and demand for self-service, many are questioning their success metrics and the real success numbers to ensure their dependencies on these platforms.
First let’s explore the basics of business intelligence platforms.
Business Intelligence (BI) platforms are systems that allow organisations to collect, clean, analyse, visualise, and share data in order to make better decisions. They aggregate data from multiple sources, provide reporting and dashboards, offer interactive visualisations, and often include advanced analytics.
.avif)
Every business collects data: customer transactions, website clicks, supply chain records, employee metrics, and financials. The real question is: does that data actually change how decisions are made? For most organisations, the answer is “not enough.” That’s where a Business Intelligence platform becomes critical.
A BI platform organises scattered, siloed information into a single version of the truth.
So instead of chasing spreadsheets or gut-feel decisions, leaders can see exactly what’s happening across sales, operations, finance, and customer experience in real time.
Efficient BI platforms provide a shared lens for the business to measure performance, identify inefficiencies, and respond faster to change.
It also raises the maturity of decision-making. Without BI, insights are reactive; teams look at what happened. With BI, businesses start to predict what’s next. Advanced analytics, scenario modelling, and trend detection move the organisation from hindsight to foresight. That shift is what allows businesses to compete in fast-moving markets.
Democratising access to insights is yet another capability driven by business intelligence products like BI platforms. Instead of relying on a central analytics team to answer every question, employees across functions can explore data themselves, through dashboards, BI data visualisations, and self-service reporting. That means frontline teams can act on insights as quickly as executives, embedding data-driven thinking into daily operations.
A Business Intelligence (BI) platform is built to help organisations consume insights. These platforms focus on reporting, dashboards, and visualisation, turning raw data into actionable insights consumable by business users.
The core advantage of business intelligence platforms lies in their accessibility that enables non-technical teams to make decisions from trusted data.
A Data Analytics platform, on the other hand, is designed to explore and experiment with data with deeper analytical capabilities like statistical modelling, ML, and predictive analytics, enabling data scientists and analysts to explore patterns, build models, and run advanced simulations.
💡The relationship between BI & Big Data
For BI platforms, this matters because dashboards and reports are only useful if they keep pace. A capable platform scales with growing data demands; without that, insights lag behind, and decisions start relying on outdated or incomplete information.
For BI platforms, this matters because dashboards and reports are only useful if they keep pace. A capable platform scales with growing data demands; without that, insights lag behind, and decisions start relying on outdated or incomplete information.
.avif)
The functions of a BI platform span the entire journey of data, from messy inputs to business-ready insights:
Data lives across databases, CRMs, ERPs, marketing tools, and cloud apps. A BI platform’s first job is to pull it together into a single layer. Without this, every team is exposed to a different “truth,” and decisions drift. Integration is about collapsing silos so the business has one shared view of reality.
Raw data is rarely ready for prime time. It’s inconsistent, messy, and often misleading if taken at face value. A BI platform handles the cleanup, standardising, transforming, and modelling the data so it speaks the same language across the business. This step turns disconnected records into a trustworthy foundation for data assets.
Reports are the baseline. But BI goes further, giving analysts the ability to run deep queries while also enabling non-technical users to explore data themselves. That mix of depth and accessibility is what makes analysis both fast and scalable.
A spreadsheet full of numbers does not drive actions. BI platforms convert those numbers into dashboards, charts, and reports where patterns stand out instantly. It’s less about the visuals themselves and more about creating a language the business can actually respond to.
Dashboards locked in one team’s inbox do little for the business. BI platforms make insights portable, shared across departments, embedded in daily workflows, and delivered to the right people at the right moment. This is how decisions stay consistent, and the organisation moves with one version of the truth.
Reports that arrive weeks later can’t keep up with shifting markets. BI platforms close that gap with real-time monitoring and automated alerts, surfacing changes the moment KPIs move out of range. Early signals mean the business can intervene before small anomalies snowball into costly failures.
With AI and machine learning built in, platforms can forecast demand, surface anomalies, and even answer natural language queries. The function here is clear: move decisions from reactive explanations to proactive choices.
A BI platform by itself provides access to data, dashboards, and reports, but access doesn’t automatically translate into better decisions. Having the best BI tools or platforms might be a priority for many, but what if the existing BI platform can have enhanced outcomes?
Data products come in here. The landscape of business intelligence and analytics could see a shift in capabilities with data products.
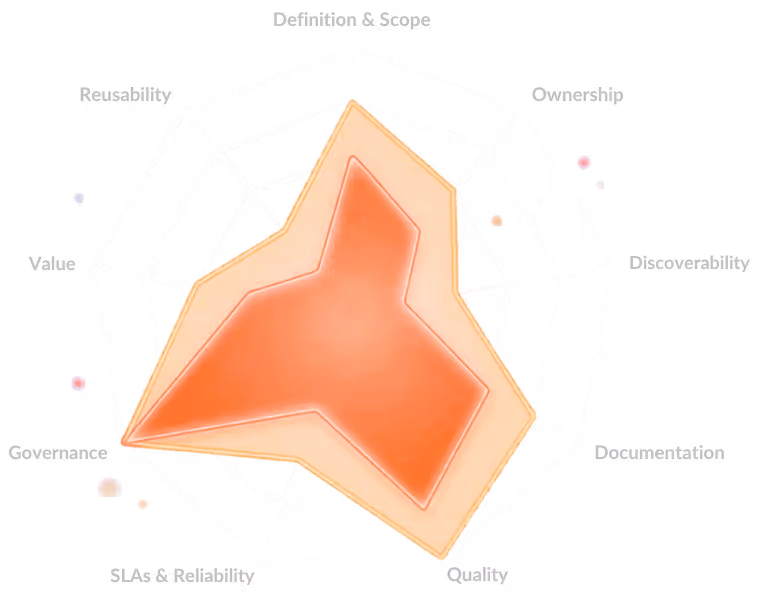
Instead of each BI dashboard or report re-computing or redefining metrics, data products capture business-meaningful metrics, dimensions, aggregations, and logic (e.g. “active user count”, “churn rate”, “customer lifetime value”, “inventory turnover”) as owned, versioned, tested assets with clean interfaces. They come with lineage, SLA, ownership, and can be consumed by analytics, BI dashboards, AI models, and agents.
Consistent definitions anchor every dashboard and report, speeding up iteration by removing the need to rebuild logic. Trust grows as numbers are transparent and verifiable, while the same metric layer scales seamlessly across BI, ML models, and agents.
Pain Points it addresses:
Learn more about implementing a metrics-focused data strategy with data products.
Embedding Context and Purpose
BI dashboards often overwhelm users with metrics. Metrics multiply faster than anyone can process. Data products cut through the clutter, giving structure and context: they show which data matters, how to interpret it, and what decisions it should drive.
A “Customer Churn Score” or a “Supply Chain Health” product isn’t just a number; it’s a signal you can act on. Teams don’t spend time decoding dashboards; they instantly see meaning.
This clarity accelerates decision-making, focusing on the real drivers if the business.
Data products here are not just metrics, but curated, well-documented datasets or feature sets that are discoverable and usable by non-technical and technical users alike. They may include ready-to-use datasets (for common analyses), feature sets for predictive models, or agent-friendly data APIs. Coupled with strong metadata, lineage, documentation, and discovery tools, this makes data exploration and usage significantly smoother.
The value it adds:
Democratization
More teams (marketing, operations, product, AI) can self-serve data, reducing dependency on central data/IT.
Speed
Time to insight comes down, since people don’t have to wait for data engineering to build up new data or ETL pipelines, cleansed datasets, etc.
AI readiness
When data products expose clean, well-tested features/datasets, AI/agents can more reliably build models or make decisions.
Innovation
Teams can experiment more, explore “what-if” scenarios, build new dashboards, agents, etc.
BI bottlenecks that the self-service capability of data products help to address
Without data products, BI teams often replicate logic across dashboards, reports, and departments. Data products promote reusability, so once a data product is built and validated, it can power multiple dashboards, analyses, and decision workflows. This not only improves efficiency but also ensures consistency in insights across the business.
Using data products within a BI platform strengthens governance by turning implicit rules into explicit contracts. Each data product carries clear ownership, lineage, access policies, and quality checks, so governance shifts from being an after-the-fact audit to being designed into the data itself. This reduces ambiguity over “who owns what,” makes regulatory compliance traceable at the metric or dataset level, and ensures BI users consume data that already meets security, privacy, and quality standards. In effect, governance becomes less about restricting use and more about building trust and accountability into every insight the BI platform delivers.
Ensuring Trust and Consistency
Conflicting KPIs often lead to debates across departments on numbers instead of acting on them. By standardising metrics, business logic, and transformations, data products create a single source of truth that BI platforms can reliably expose. This builds trust in dashboards, aligns decisions across teams, and helps the organisation move faster without constant second-guessing.
📖 Related Reads
Learn more about the value of data products in improving and scaling governance across orgs, here ↗️
Today, one of the keynotes is to transform BI tools and platforms into trusted, reusable assets instead of static reporting tools. Traditional BI focuses on delivering reports and dashboards, but with data products, the emphasis moves to creating durable, reusable assets that continuously deliver value across domains. This means BI isn’t just answering today’s questions, but becomes a foundation for innovation, where the same productized data drives experimentation & operational decisions, compounding impact over time.
Q1. What is an enterprise business intelligence platform?
An enterprise BI platform, in contrast to any BI platform, extends these capabilities across the whole organisation. It adds scale (handling huge volumes and concurrency), governance (role-based access, compliance, lineage), integration with enterprise systems (ERP, CRM, cloud apps), collaboration features, and support for advanced workloads like AI/ML.
Q2. Is ETL a BI tool?
No. ETL (Extract, Transform, Load) is a data integration process, not a BI tool. Its role is to prepare and move data into storage in a clean, structured way. While not a BI tool itself, ETL often serves as the foundation for BI, ensuring that the data BI platforms analyse is consistent, reliable, and ready for insight. Hence, there remain dependencies between ETL and business intelligence.
Your Copy of the Modern Data Survey Report
Better decisions start with shared insight.
Pass it along to your team →
Your Copy of the Modern Data Survey Report
Better decisions start with shared insight.
Pass it along to your team →


Find more community resources
Modern Data 101 is a movement redefining how the world thinks about data. A community built by the same team behind the world’s first data operating system, Modern Data 101 sits at the intersection of data, product thinking, and AI. Spread across 150+ countries, the community brings together a global network of practitioners, architects, and leaders who are actively building the next generation of data systems.
At its core, Modern Data 101 exists to simplify the journey from raw data to tangible and observable impact. It advocates high-potential data systems and next-gen architectures to unify and activate insights and automation across analytics, applications, and operational workflows at the edge.
In a world shifting from data stacks to AI ecosystems, Modern Data 101 helps teams not just navigate the change but lead it.

Find all things data products, be it strategy, implementation, or a directory of top data product experts & their insights to learn from.
Connect with the minds shaping the future of data. Modern Data 101 is your gateway to share ideas and build relationships that drive innovation.
Showcase your expertise and stand out in a community of like-minded professionals. Share your journey, insights, and solutions with peers and industry leaders.


.avif "Brij Mohan Singh")