


Access full report
Oops! Something went wrong while submitting the form.

🤍

Facilitated by The Modern Data Company in collaboration with the Modern Data 101 Community
Latest reads...

%20(1).png)

.png)
TABLE OF CONTENT


TOC
Mendeleev’s Genius
Framework for Projecting Data Needs
Using Projections for Long-Term Platform Alignment
-Why Data Platforms Become Irrelevant
-Mapping the Unknown Needs: Vacant Spots
Translating the Framework into Architecture
-Platform Decoupling is Non-negotiable
-Data Products as the Interface b/w Platform & Business Need
-Interfaces at Different Levels of Abstraction
The Framework in Action
Where the Platform Learns to Bend
Check out our anonymous poll here.
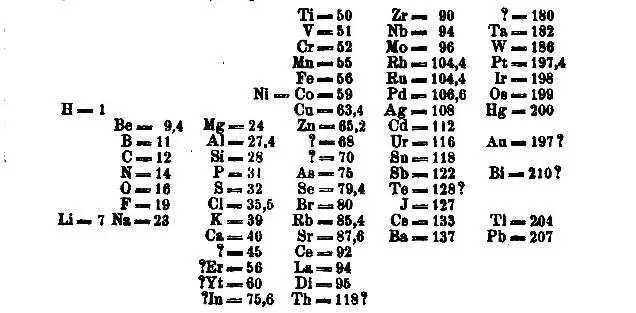
When Dmitri Mendeleev arranged the periodic table in 1869, he did something extraordinary: designed for the unknown. His brilliance didn’t lie in cataloguing the 63 known elements, but in foreseeing what must exist beyond them.
He left deliberate gaps, placeholders for the undiscovered entities, trusting the coherence of his framework more than the completeness of his data.
Years later, when gallium, scandium, and germanium filled those spaces exactly as he predicted, the framework itself was validated.

That is the essence of architectural foresight. The goal of a data platform is not to capture the present, but to anticipate the future and build a schema of possibility. Today’s design should already know where tomorrow’s needs will fit, even if those needs are not yet visible.
The genius of such systems lies in their intentional emptiness. “Vacant spots” left open for emerging consumption patterns, new decision modes, and autonomous agents of action.
Because what ultimately defines an enduring platform isn’t how much it covers today, but how naturally it can absorb what tomorrow brings.
Every analytics need has a precise position within a three-dimensional space that defines
The Cuboid of Future Needs
A predictive surface that helps data leaders not just visualizse the present, but anticipate where demand will migrate. Like Mendeleev’s table, it reveals both what exists and what must come next.
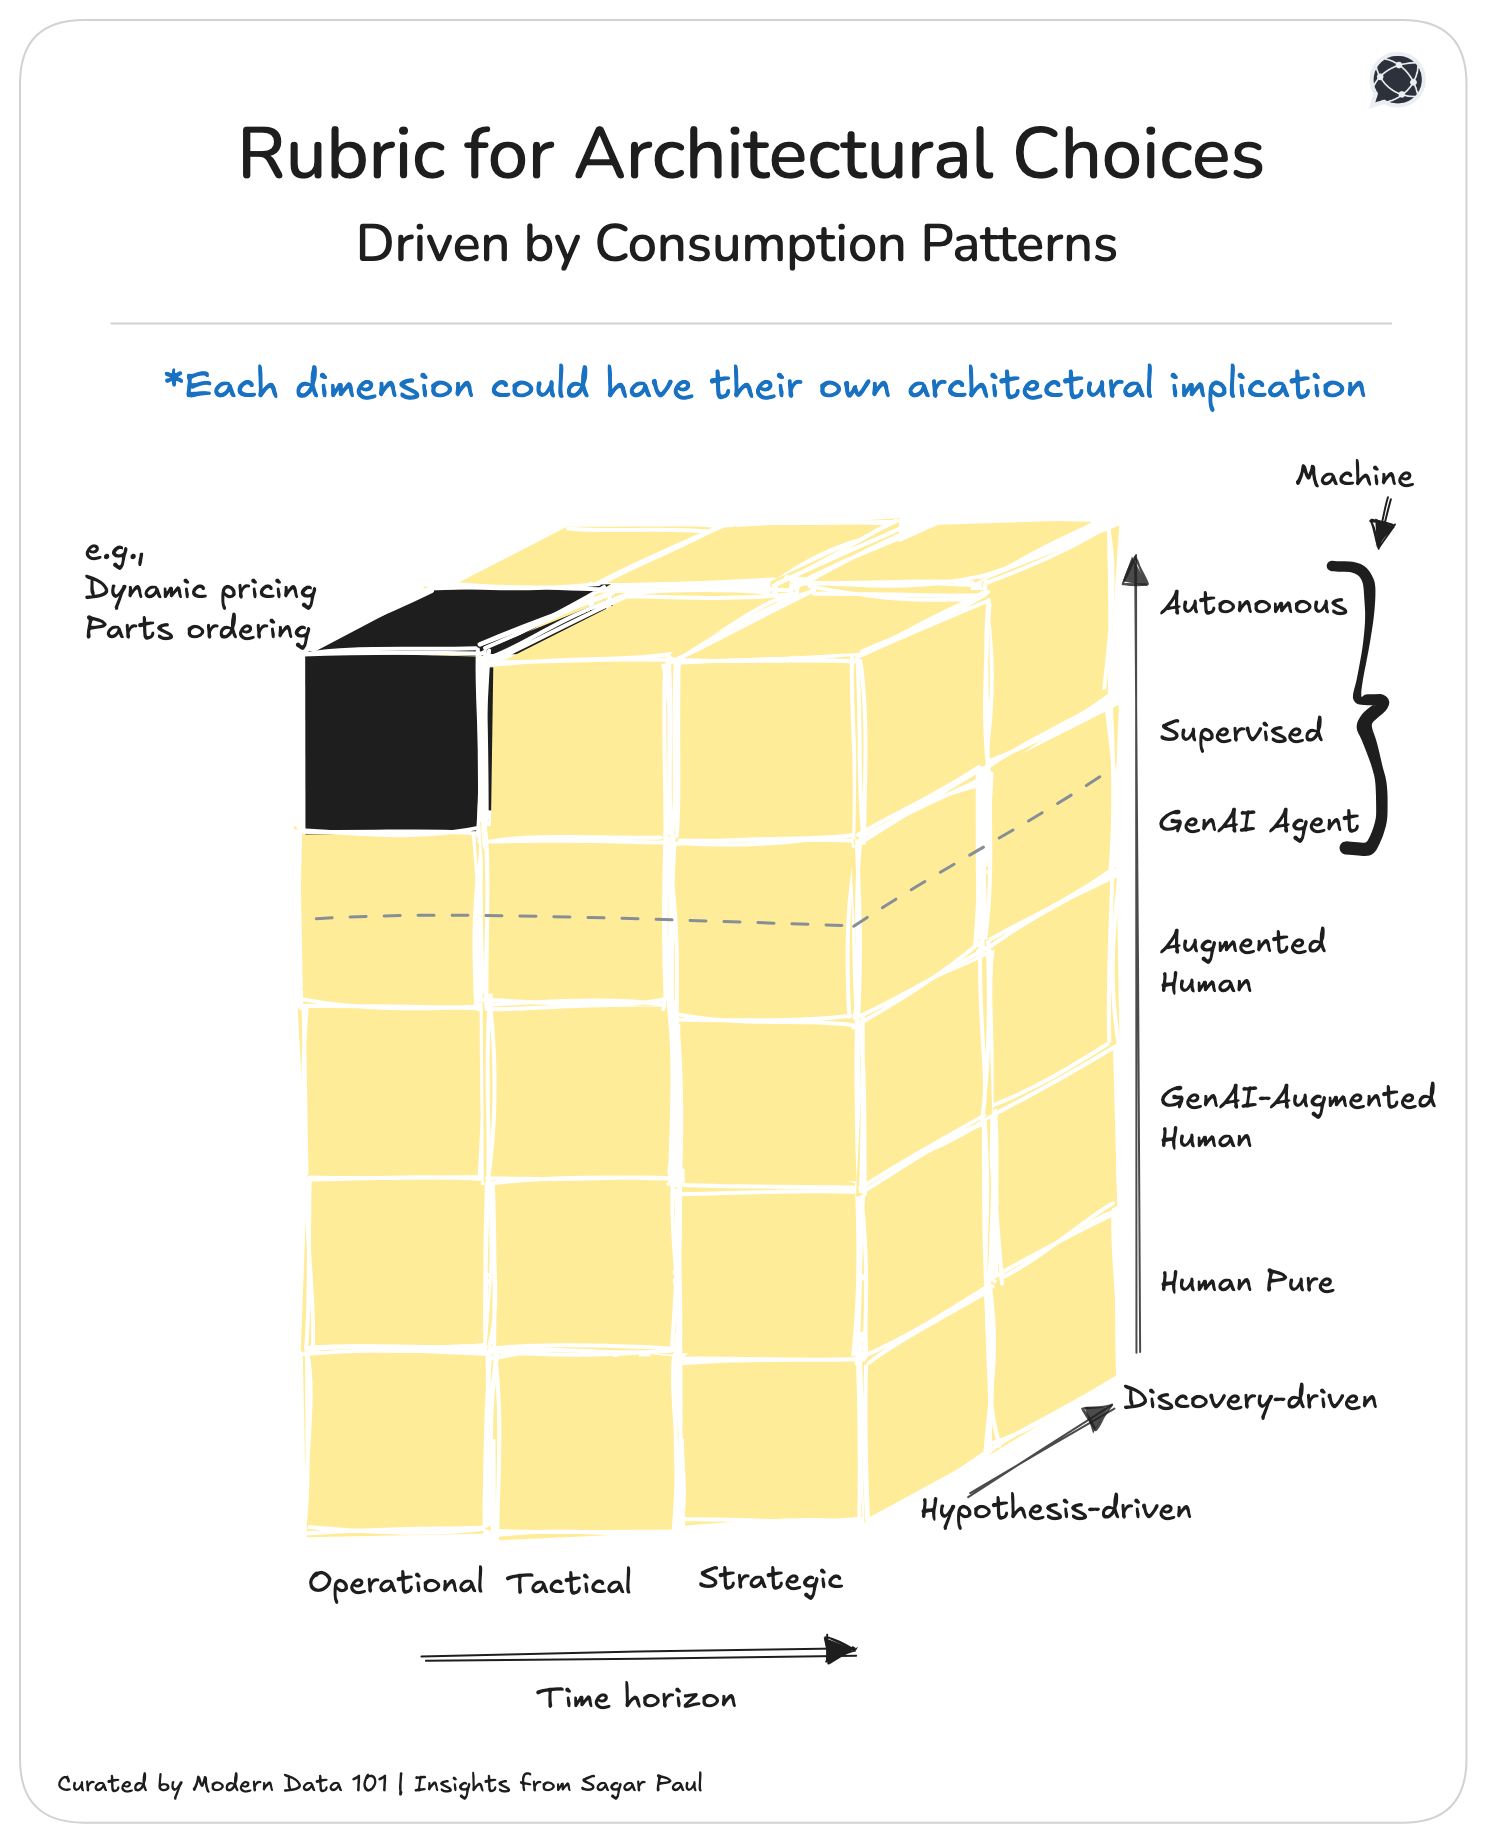
From pure human actions to autonomous operators across the board. Each step along this axis shifts the center of gravity from interpretation to automation. It defines how much of the decision remains interpretable to humans versus delegated to machines. Trust, explainability, and control evolve in tandem.
The Five Scales in the Consumer Spectrum
📝 Related Read
Chain of Thought Monitorability: A New and Fragile Opportunity for AI Safety
“In a joint paper published earlier…and endorsed by prominent industry figures, including Geoffrey Hinton (widely regarded as the “godfather of AI”) and OpenAI co-founder Ilya Sutskever, the scientists argue that a brief window to monitor AI reasoning may soon close.”
~ Techxplore
From hypothesis-driven → exploratory. This dimension represents the logic of discovery. Movement from validating what we already suspect to imagining what we haven’t conceived yet. It defines whether analytics serves to confirm or to reveal.
Two scales in Inquiry Mode
From Strategic → Tactical → Operational. This axis captures the temporal horizon and capital exposure of the decision.
The three scales in Decision Tier
Each analytics use case, when plotted inside this cuboid, becomes a dot on the map of consumption. Patterns begin to emerge: clusters of current demand, voids that signal untapped opportunity, and gradients showing where organizations are evolving next.
Every data platform begins as a perfect “fit-for-purpose.” And then time ensues.
The very optimization and USPs that once made it powerful in youth become the solid anchors that hold it back later on.
What was designed to serve today’s workflows hardens around them, unable to flex with the way decisions evolve. The result is that it becomes noticeably obsolete with time…
…because the context around it changed faster than its structure could adapt.
Every major data investment decays when it’s designed for the “now.” Longevity comes from predicting direction: understanding the grammar of analytics consumption that will define the next decade.
The goal is not to fill every feature gap, but to achieve structural completeness: an underlying order that can host whatever new forms of intelligence, interfaces, or agents emerge.
[playbook]
The true power of the Cuboid is projection instead of classification (which might seem more apparent at first glance). It allows us to map three temporal layers at once
Frameworks built this way act like a compass. When the landscape of needs and requirements around us evolves faster than platforms, it’s the compass that keeps us from getting lost.
By plotting use cases across the Cuboid, organizations begin to see three distinct territories:
The result is a predictive map of enterprise intelligence. A landscape that not only charts the present but also exposes the “vacant spots” of tomorrow.
Every unoccupied intersection in the Cuboid: say, Strategic × GenAI Agent × Discovery; represents a missing element in the enterprise periodic table. These are gaps of inevitability. Will happen.
Over time, as AI maturity deepens and organizational trust in automation expands, consumption migrates diagonally across the Cuboid, from Human × Hypothesis × Operational toward AI × Discovery × Strategic.
By knowing beforehand what element of need we would be serving, the platform investment develops long-term relevance or what is popularly referred to as future-proofing.
To ensure that we need to translate this framework into architecture, or guide the data architecture with this framework in mind.
We’ve entered a cycle where the tooling surface area expands faster than any team can standardise. New catalogs, new observability layers, new orchestration frameworks, new AI agents. Every quarter, the ecosystem grows, fragments, and redefines “best practice.”
But tools don’t change because vendors innovate. They are mostly replaced by another or a newer version because the organisation itself keeps changing. New business lines, new customer motions, new data shapes, new regulatory pressures, and suddenly the “perfect” stack from two years ago feels brittle and obsolete.
In this environment, the endurance, longevity, or ROI of a data platform no longer comes from picking the right tool. It comes from designing a cushion that survives tool churn.
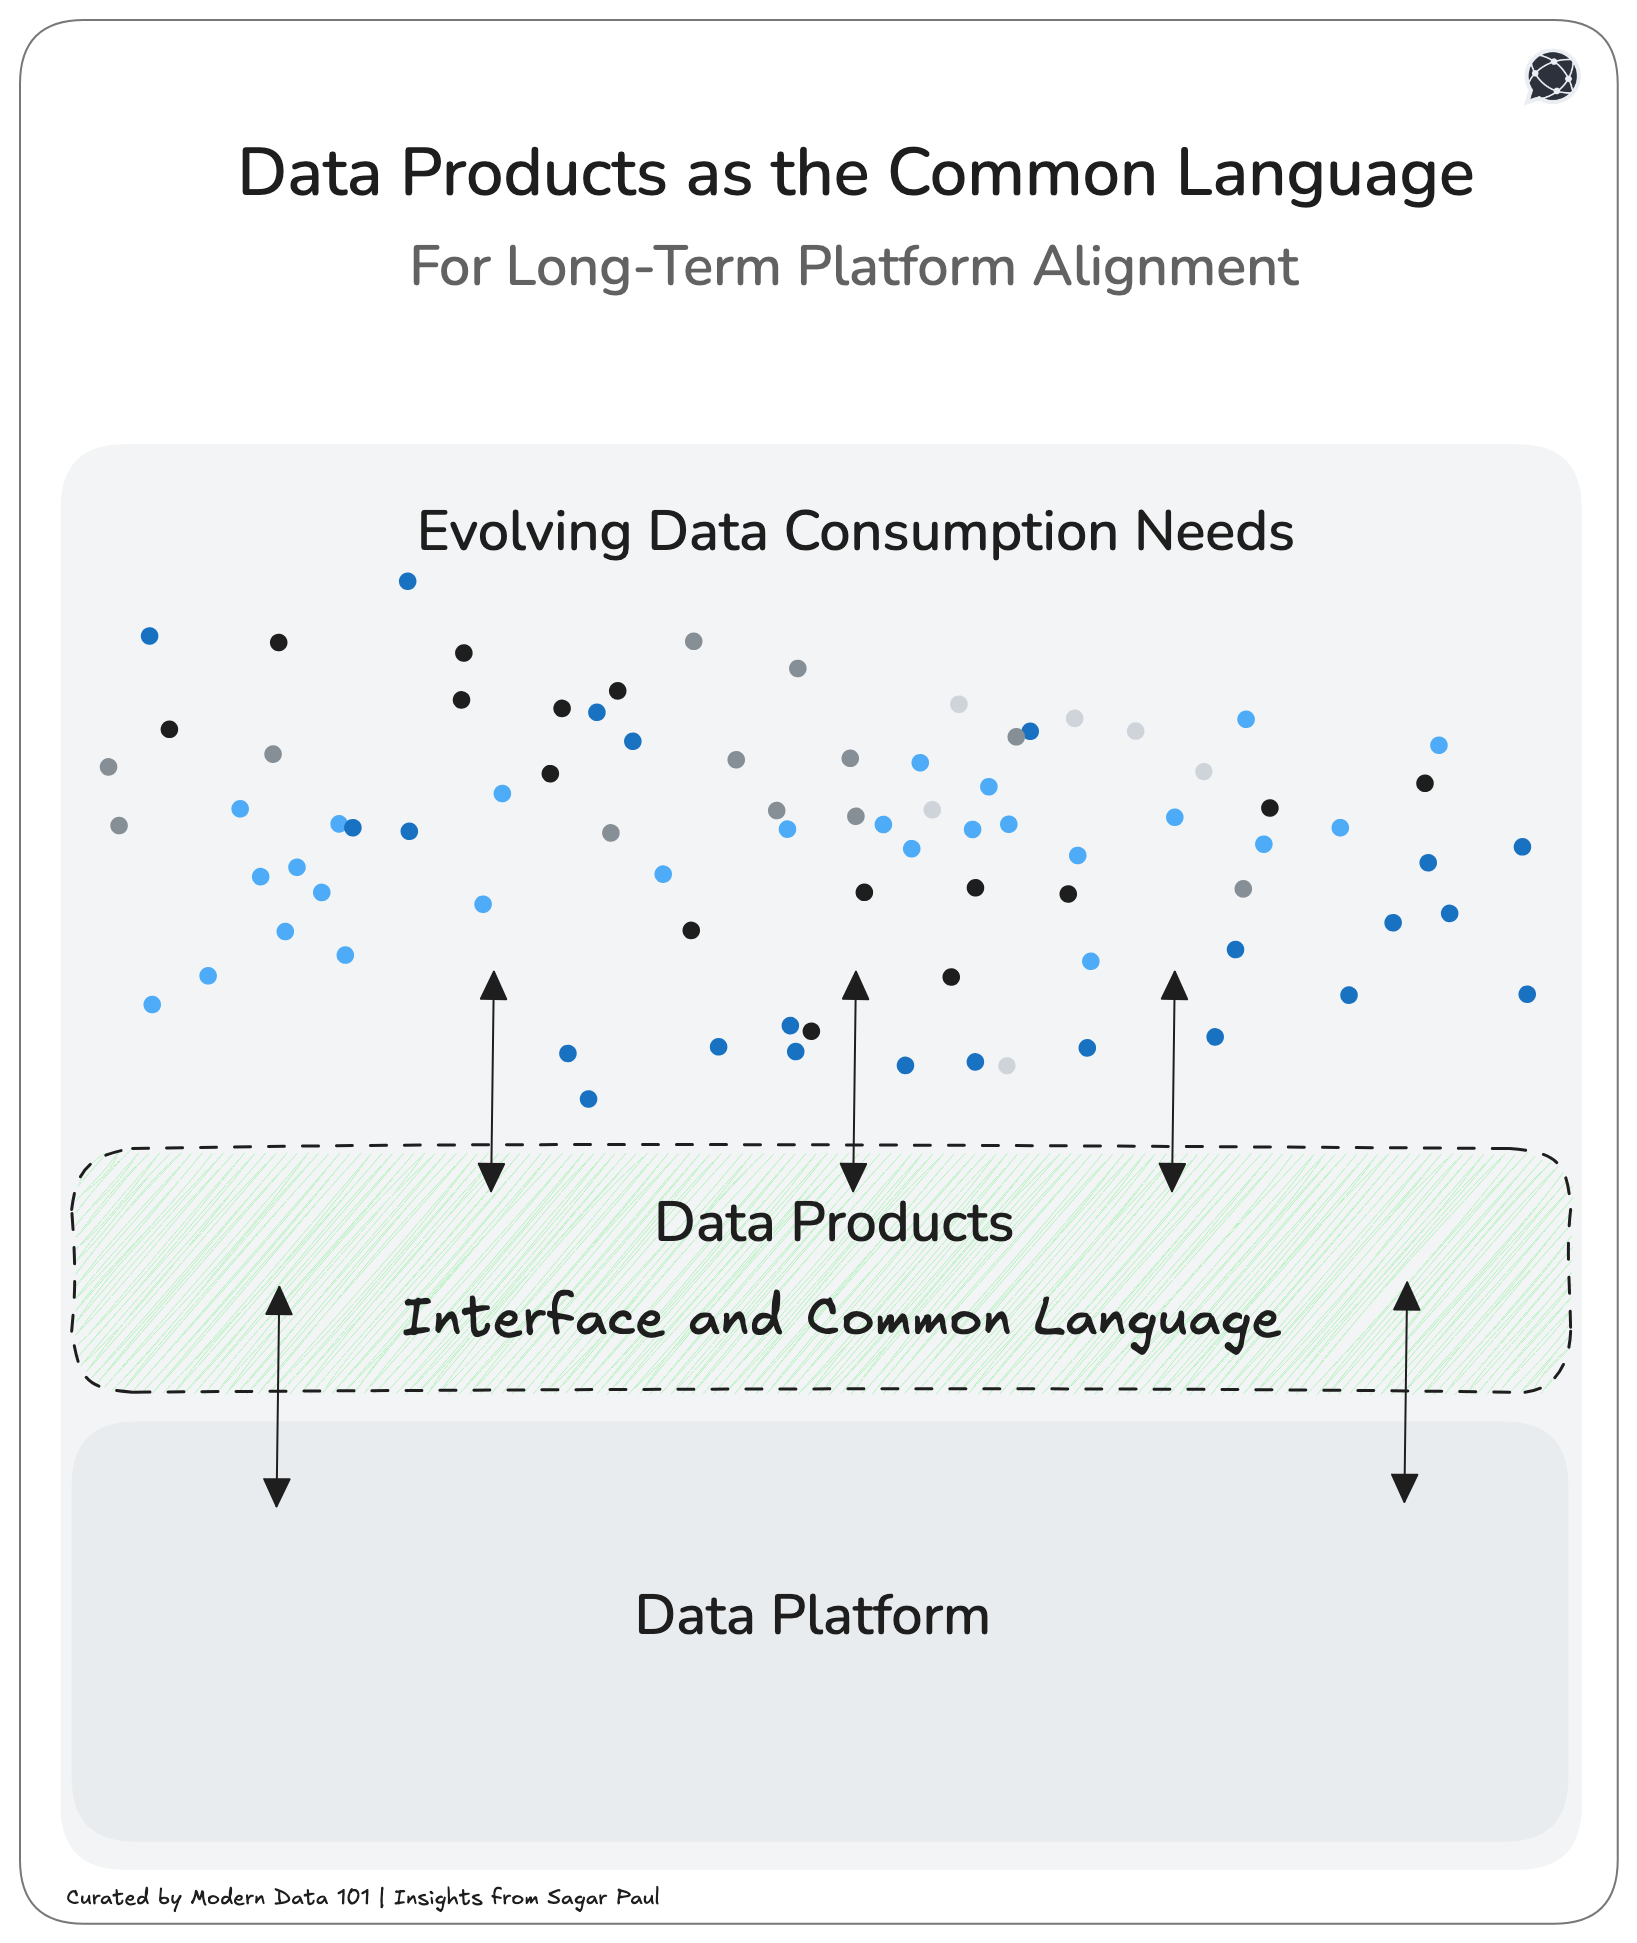
That design is when data is brought into the middle.
Here, the data IS the interface.
Data products are a data design paradigm that enables the “data-as-interface” vision
and sits between self-serve platforms and the constantly shifting ecosystem of business needs and requirements, tools, and third-party applications.
Data products absorb volatility. They present consistent semantics even if the underlying tools, pipelines, or compute engines rotate underneath.
They let the platform evolve without breaking the business, and they let the business evolve without breaking the platform.
Once you map an organisation onto the Cuboid framework of business requirements, it would be spatially visible how every coordinate in the consumption space demands its own interaction model. No single tool or platform will ever satisfy all of them over a decent period of time. However, a common language or a common interface would. And this common language is data on data, productised and ready for specific calls to specific business goals, current or projected.
A well-designed Data Product is not a dataset or a schema or a table. It is a product that is purpose-aligned to the business goal it was designed for, and also the agnostic interface that insulates the organisation’s data from the volatility of tools, vendors, and platforms.
Data Product is the layer that refuses to let meaning be captured or contextualised by the semantics of whatever technology happens to host it today.
This is the core idea of data as interfaces: the semantics, context, business logic, contracts, and truths travel with the data itself, never with the machinery surrounding it.
And when this principle is honoured, Data Products gain a remarkable resilience. They can:
In the Cuboid’s language, Data Products become the stable primitives, the intentionally designed anchors that remain intact while consumption patterns flow and mutate across Consumer Types, Inquiry Modes, and Decision Tiers. They are the constant in a landscape where everything else is in motion.
This interface principle becomes even more powerful when we recognise that Data Products exist at three distinct layers, each becoming an interface for a different class of problem:
These mirror the operational source systems and anchor the organisation to ground truth. They act as the interface to reality (the physical data layer): preserving fidelity, lineage, and original semantics. At this level, the data product insulates intermediate data consumers from the chaos, schema drift, and idiosyncrasies of transactional systems.
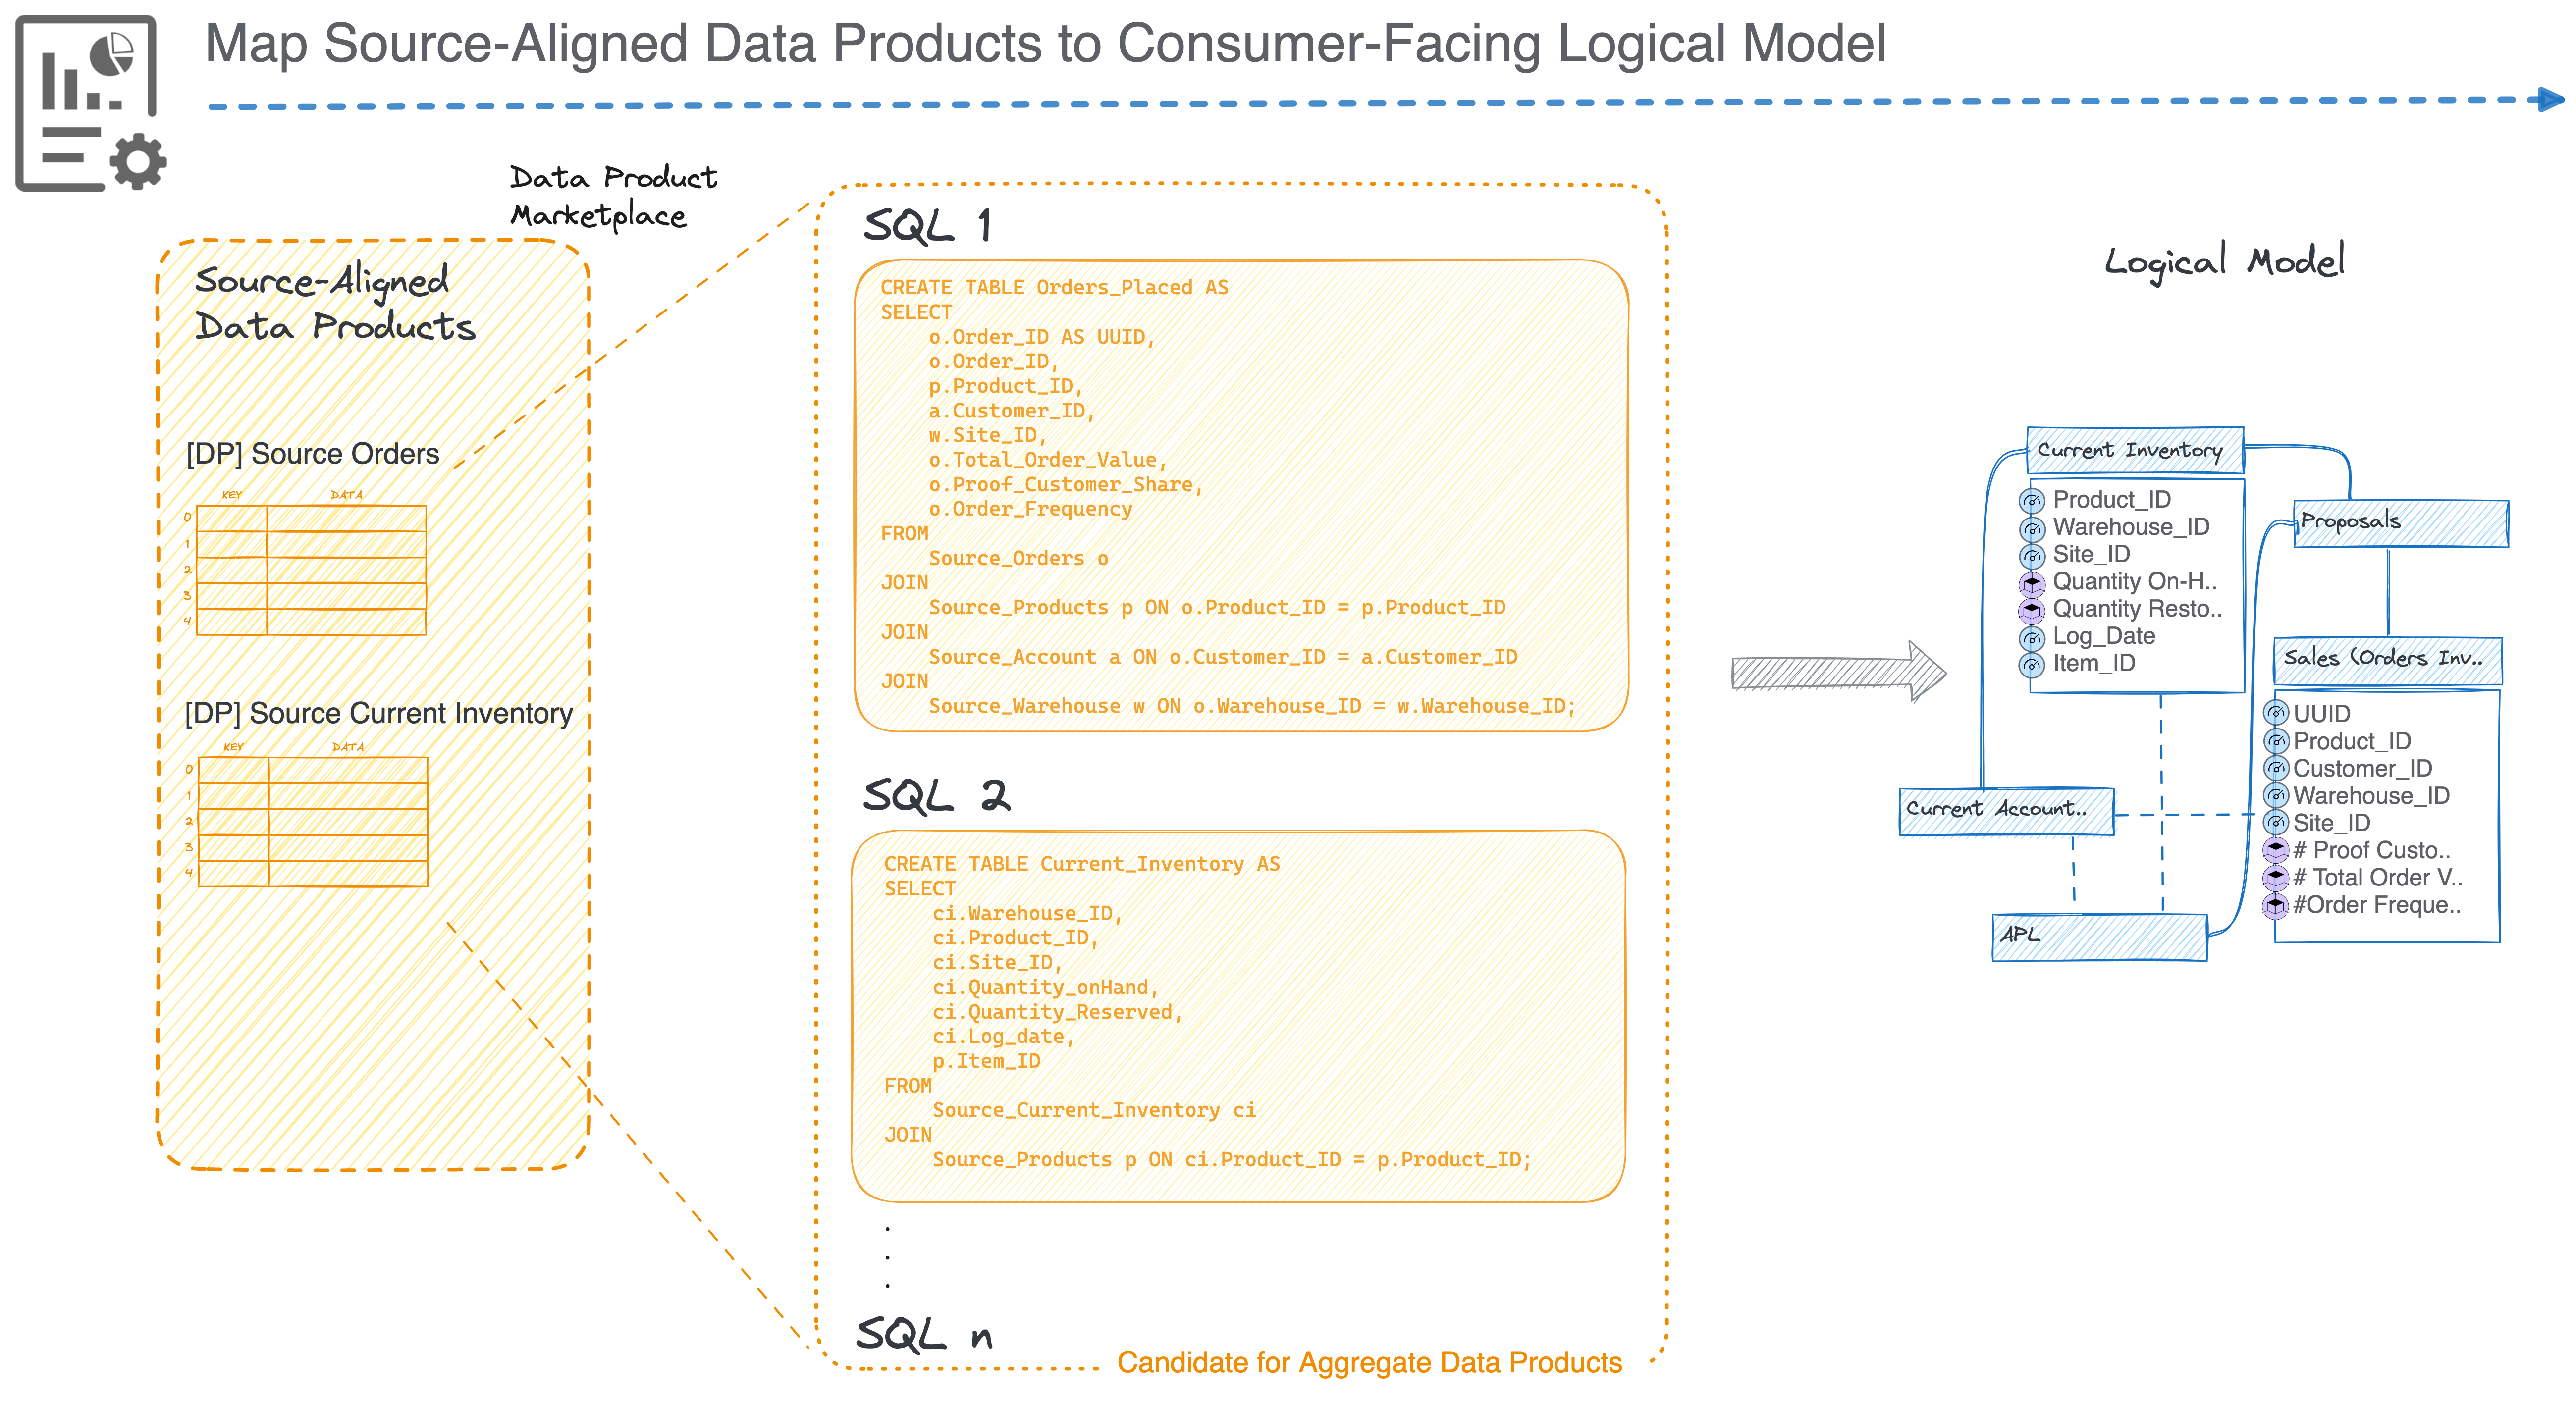
These sit one level up, synthesising multiple sources into harmonised business constructs: Customers, Orders, Inventory, Risk Profiles. They form the interface to shared meaning: the cross-functional truth that survives system migrations, team reorganisations, and tool churn.
[report-2025]
These are crafted around business goals, decisions, workflows, applications, and analytical modalities. They are the interface to action: optimised for specific decision tiers, inquiry modes, or AI/agent-driven consumption patterns. For example, where an Agent would use the data product to trigger operational systems. At this level, the data product becomes the “last-mile abstraction” that shapes how insights and algorithms engage with the organisation’s knowledge.
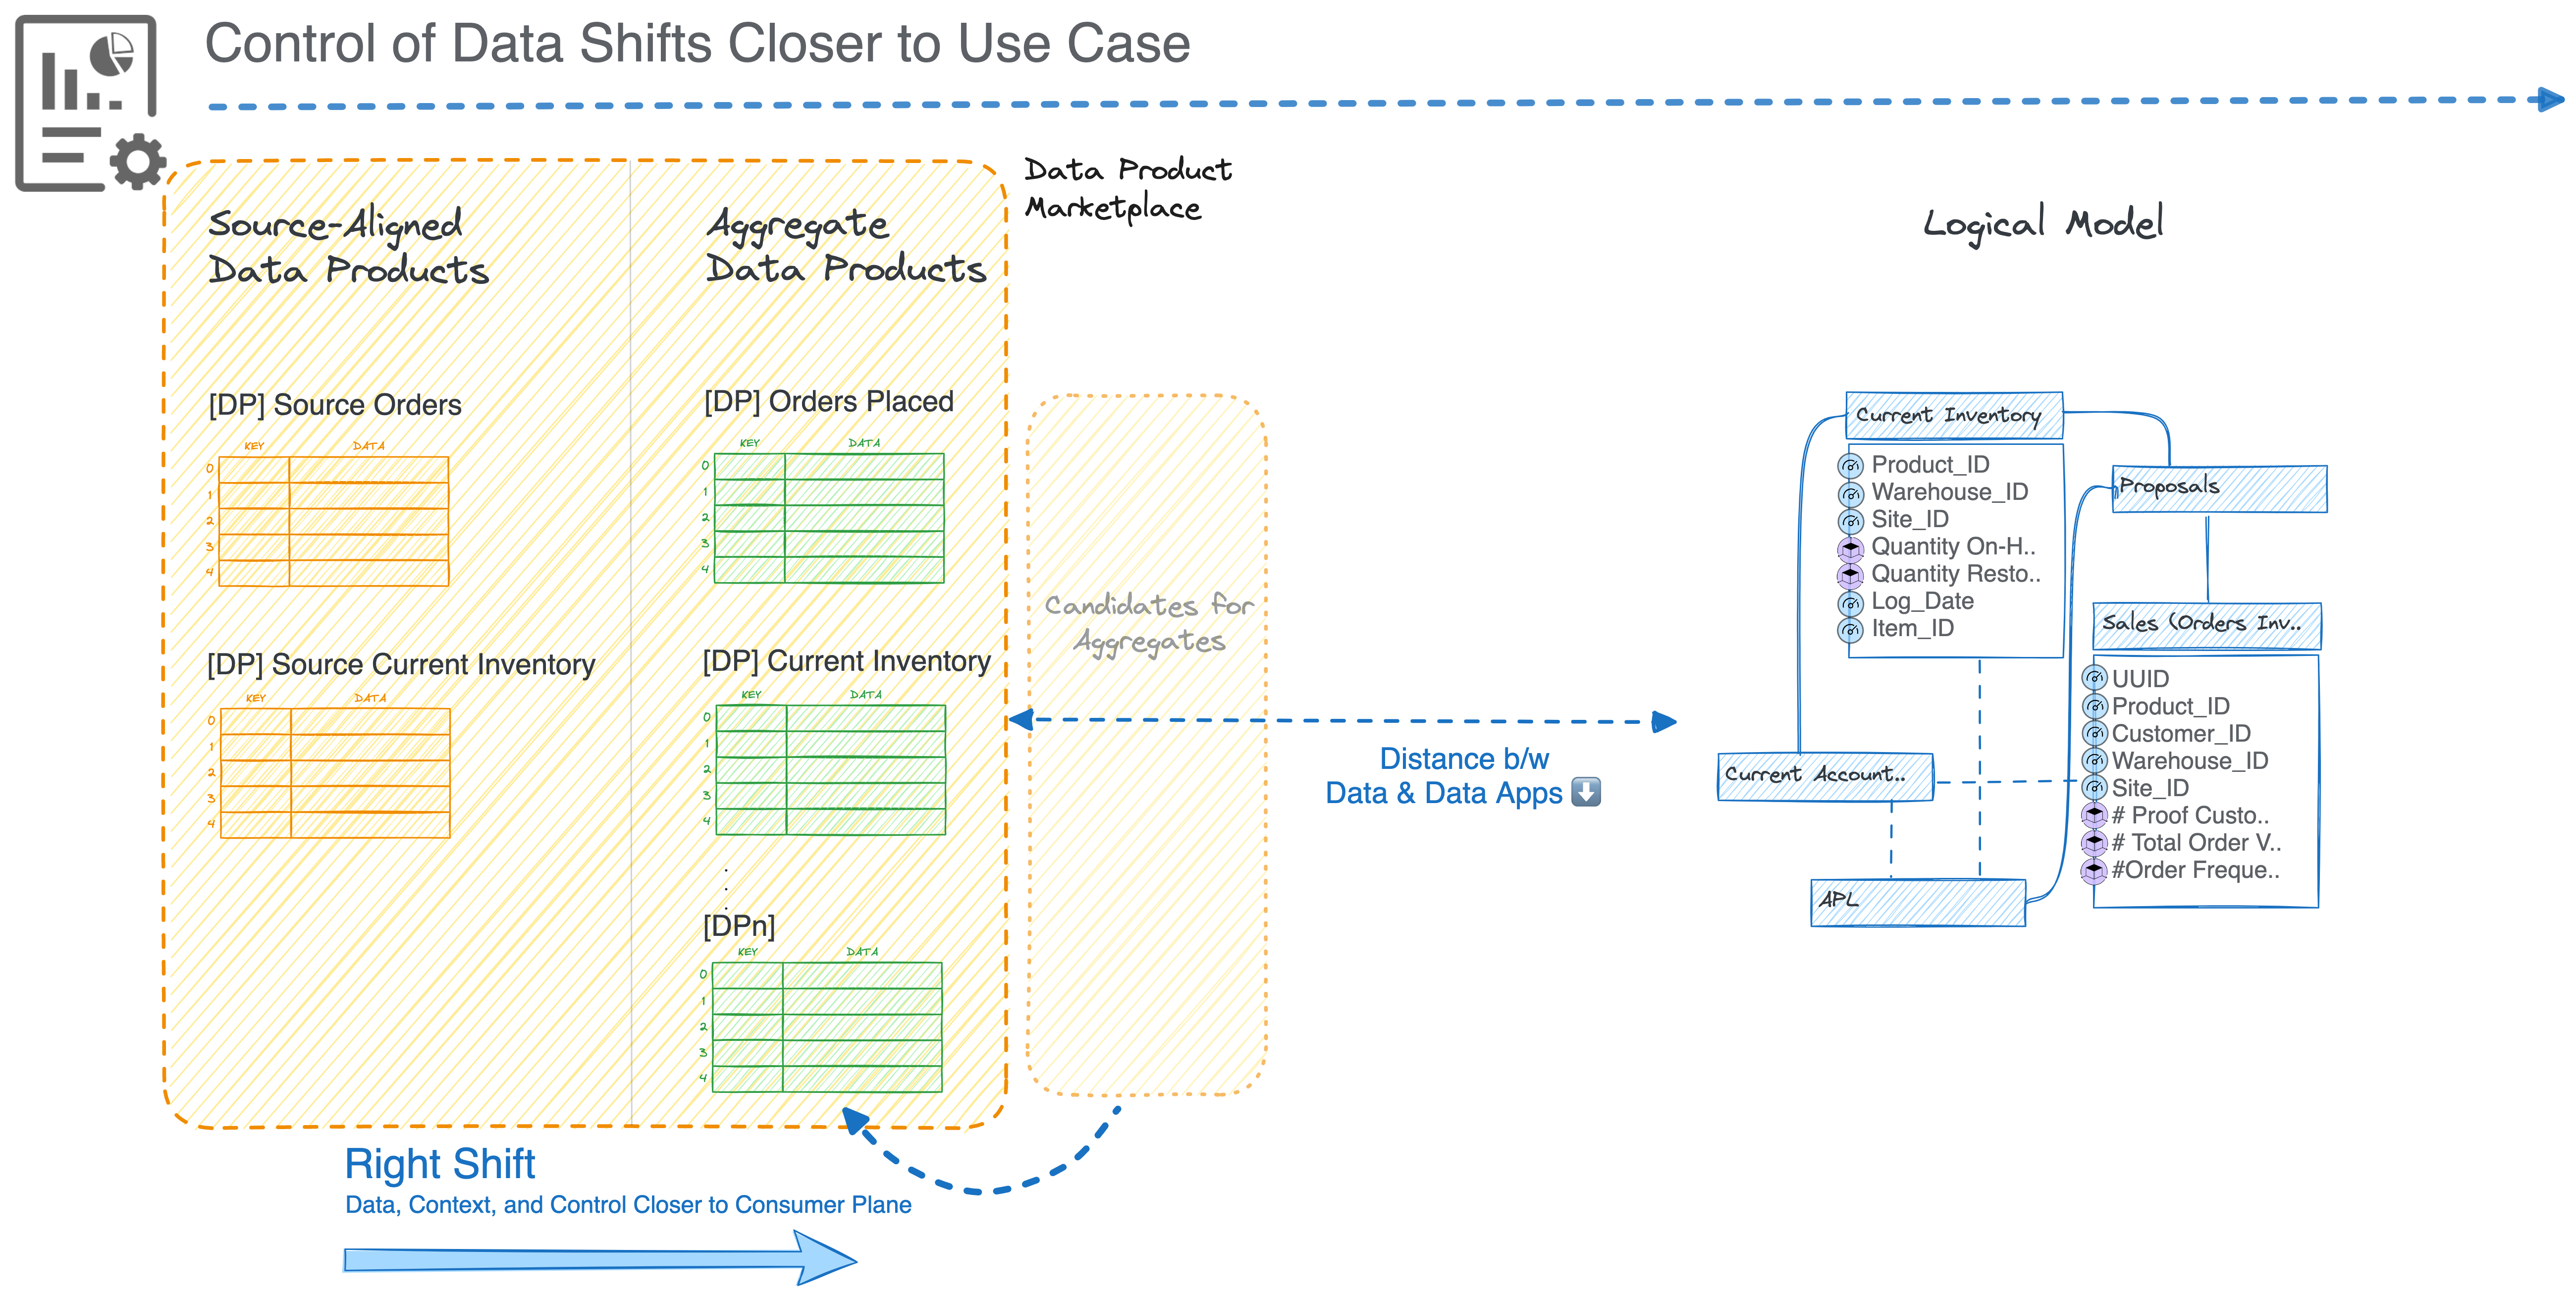
Together, These Three Layers Form a Hierarchy of Interfaces
And when designed intentionally, these layers create a system where data remains portable and platform-agnostic, semantics remain intact across migrations, AI systems consume stable, well-structured meaning, and teams can innovate at the edges without breaking the platform core.
The Cuboid is a taxonomy of data consumption, and it’s a predictive surface. It shows where meaning concentrates, where friction will emerge, and where Data Products must be engineered to withstand the churn of tools and shifting organisational appetites.
The Cuboid gives organisations the foresight to design Data Products that remain relevant regardless of which axis becomes dominant in the next cycle of demand.
Longevity of platform investments is the discipline of investing once and staying relevant across multiple generations of tools, behaviours, and organisational evolution.
The Cuboid-shaped framework gives us a map of shifting needs: cognition, inquiry, and decision tier. But the real impact hits when we overlay the map onto the three interfaces of data:
Below is how this plays out across different Cuboid projections.
The “Explain it to Me” Zone
Humans investigating day-to-day issues rely on clean source truth and light, contextual aggregation instead of heavy ML. Source-aligned products anchor truth, aggregate products add minimal meaning, and consumer-aligned products present it in human-first forms. This keeps the platform relevant even as tools change, because the interface is the Data Product itself (not the tool) and the semantics stay intact.
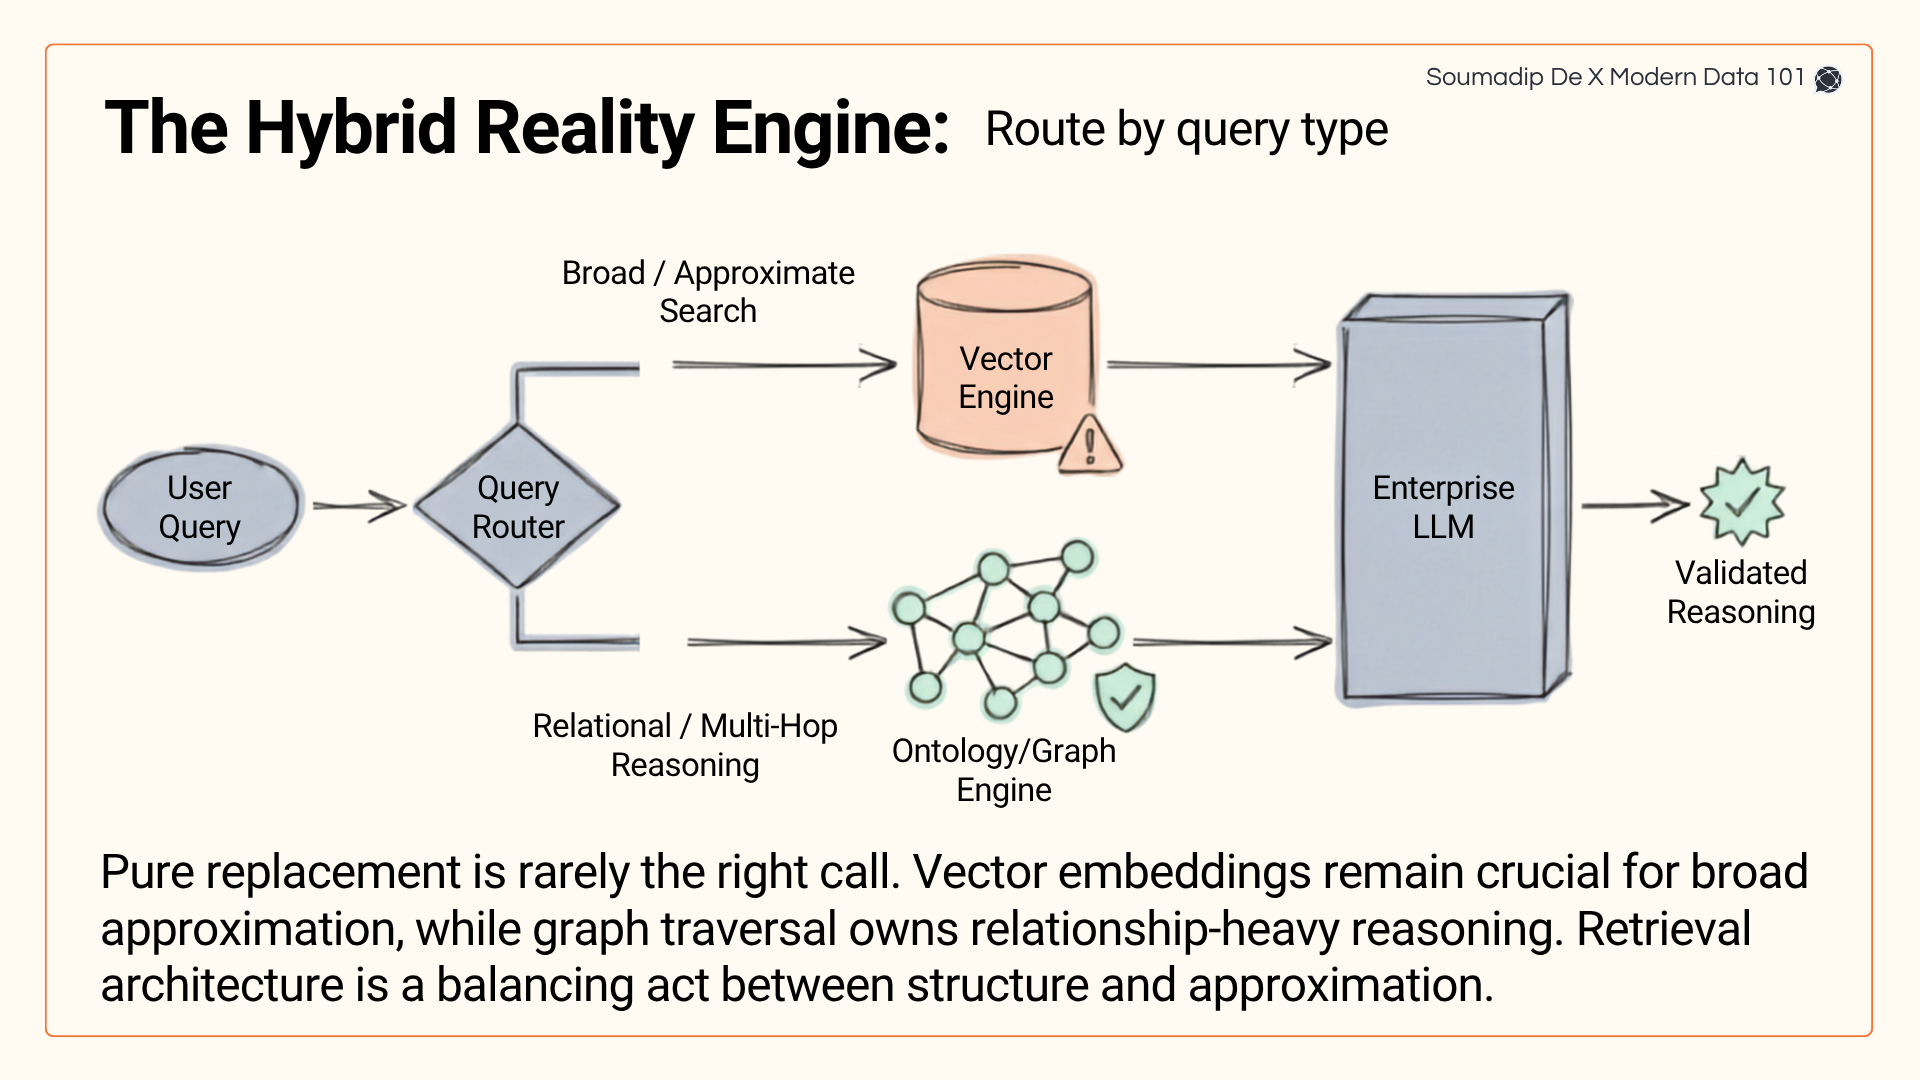
The “What Don’t I Know Yet?” Zone
Exploration demands semantics and context rather than raw events. Source-aligned products secure provenance, aggregate products provide wide, entity-centric, cross-domain meaning, and consumer-aligned products expose LLM-friendly, vectorized, multi-hop semantic surfaces. This keeps the platform future-proof even as tools shift.
The “Agent-to-Agent Coordination” Zone
Here, agents explore, negotiate, and act in tight loops, requiring temporal fidelity and stable semantics. Source-aligned products supply precise event truth, aggregate products provide structured state snapshots, and consumer-aligned products expose action-ready APIs. The platform stays relevant despite rapid agent-tool churn because every new agent inherits the same truth, the same semantics.
The “Explain + Recommend” Zone
The analyst stays firmly in the loop while AI enriches their judgment. This is the true “Explain + Recommend” layer. Data Products anchor the workflow by providing defensibility from source-aligned lineage, analytical grain through aggregates, and consumer-aligned recommendation surfaces. And while BI tools or recommendation engines keep evolving, the backbone of lineage, semantics, and contracts endures.
The “Self-Evolving Enterprise” Zone
The enterprise begins to function like a self-evolving system: constantly sensing, forecasting, simulating, and adapting. Interfaces for evolution: Source-aligned memory, aggregate cognition, and consumer-aligned action interfaces. And while future strategic AI tools are unpredictable, every agent will still rely on the same invariants (history, meaning, and decision-ready formats).
Because Data Products act as interfaces, not implementations, the platform becomes agnostic to BI tools, AI tooling, model hosting paradigms, compute engines, and even to organisational reshuffles and strategy shifts. The interfaces remain stable while the Cuboid’s coordinates shift endlessly.
A data foundation that adapts as the organisation migrates across the Cuboid of organisational requirements becomes proportional to a compounding return on the platform investment.
So far, we’ve been discussing a data design approach. Data products or designing data as interfaces is a design choice. The choice of architecture adds to this flexibility, consequently impacting the chosen platform’s longevity.
To build for endurance is to architect interfaces and create shapes with independent infrastructure resources that flex as the logic of consumption evolves. Combinations of these LEGO-like entities are able to accurately and cost-effectively reflect the shape of the data products or the interfaces designed to serve variations in data consumption over a significantly long timeline.
Flexibility, in this sense, becomes the highest expression of foresight.
The measure of a platform’s long-term relevance is not its feature set but its ability to shift weight across these data interfaces (or data products).
The Cube becomes a compass for prioritisation, guiding investments toward components that will remain relevant across eras of consumption.
A truly future-ready platform doesn’t only serve consumption, but studies it.
Every interaction, every query, every decision trail becomes a signal in a feedback loop that reveals how intelligence itself is shifting within the enterprise. Over time, these signals form a cartography of consumption, showing not just where users are, but where they’re headed.
To achieve this, architecture must become reflective: aware of its own usage patterns, capable of observing how humans, AI, and systems co-evolve. The platform learns its map as it’s being traversed. It senses drift, anticipates friction, and adjusts form before the obsolete mood sets in.
Your Copy of the Modern Data Survey Report
Better decisions start with shared insight.
Pass it along to your team →
Your Copy of the Modern Data Survey Report
Better decisions start with shared insight.
Pass it along to your team →


Find more community resources
Modern Data 101 is a movement redefining how the world thinks about data. A community built by the same team behind the world’s first data operating system, Modern Data 101 sits at the intersection of data, product thinking, and AI. Spread across 150+ countries, the community brings together a global network of practitioners, architects, and leaders who are actively building the next generation of data systems.
At its core, Modern Data 101 exists to simplify the journey from raw data to tangible and observable impact. It advocates high-potential data systems and next-gen architectures to unify and activate insights and automation across analytics, applications, and operational workflows at the edge.
In a world shifting from data stacks to AI ecosystems, Modern Data 101 helps teams not just navigate the change but lead it.

Find all things data products, be it strategy, implementation, or a directory of top data product experts & their insights to learn from.
Connect with the minds shaping the future of data. Modern Data 101 is your gateway to share ideas and build relationships that drive innovation.
Showcase your expertise and stand out in a community of like-minded professionals. Share your journey, insights, and solutions with peers and industry leaders.


