


Access full report
Oops! Something went wrong while submitting the form.

🤍

Facilitated by The Modern Data Company in collaboration with the Modern Data 101 Community
Latest reads...

.png)


TABLE OF CONTENT


As global enterprises actively work towards making their data strategies attuned to the modern paradigm, data as a product has emerged as a guiding force during this transition. Data is no longer an asset waiting on the sidelines to be transformed by teams, becoming a product that is being designed, developed, and delivered, embedded with governance, purpose, and reliability.
The importance of insights generated from data is also gaining momentum. A Deloitte report states that 68% of Chief Data Officers (CDOs) are focusing on improving the use of data-generated insights as one of their top three priorities.
This is an evolution in itself, one backed by the realisation that data needs to serve the expectations of end-users with trust, clarity, and usability, just like any customer-centric application. However, as this shift continues to make its merry way, there is still a huge blind spot for organisations, namely measurement.
While huge investments are made in data platforms, resources, and tools, there is still a lot of challenge in evaluating the ROI and business impact of these investments, and this is where Key Performance Indicators (KPIs) make a strong case for themselves.
KPIs act as the connecting link between the delivery of data assets and their usage and impact in the real world. They also provide a proper structure to evaluate performance in terms of promises and expectations across multiple business domains.
In this one, we will explore data product KPIs, their types, issues plaguing traditional KPIs, mapping KPIs to the data product lifecycle, and a few more essential elements.
[state-of-data-products]
Key Performance Indicators (KPIs) for data products are metrics structured to measure the effectiveness with which a data product performs across business and technical parameters. As data teams continue to treat pipelines, datasets, as well as services as products, KPIs become essential elements to understand the impact of success, not just by how they are built but also by the manner of their usage and the outcomes they deliver.
Data product KPIs fall into two major categories:
Once the KPIs are aligned across both dimensions, it ensures that teams are not just involved in optimising timelines but also focused on delivering products governed by underlying purpose. Technical performance without proper adoption is a wasted effort, as the data is reliable but struggles with proper usage because of lack in purpose. With the correct set of KPIs, these aspects get balanced and offer well-defined accountability in the process.
For instance, SLA adherence ensures product reliability and consistent availability. Uptime tracking gives insight into the robustness of the platform. Usage metrics like an active user count or query volume are indicative of commercial demand and relevance.
When all these metrics are aligned with the broader business objectives, organisations can shift from fluffy terms like “data-driven” to creating real, impactful data culture. It’s important to understand that data product KPIs are not just metrics for display but rather a feedback mechanism to assist product owners in iterations, enterprises in realising the ROI from their investments, and data leaders in prioritising everything in a promising synchrony.
Learn more about identifying and working around data product business metrics here.
The signs have been around for a long time. In a BARC survey conducted back in 2021, a significant 81% of their respondents said that they consider data and information as an asset.
This is the reason why data teams have, for a long time, been using metrics to keep track of performance, but the traditional ones fall agonisingly short because of the process-centric data environment that we have today. Ingrained deeply into legacy Business Intelligence (BI) and reporting dimensions, the metrics often tend to focus more on outputs rather than outcomes, which translates to increased activity but lesser impact.
If we talk about operational KPIs, most of them are inward-looking. Metrics such as refresh rates, pipeline uptimes, as well as query execution times, while essential to maintain proper infrastructure health, express little about whether the data is actually helping in better decision-making or improved business value.
Similarly, report-oriented KPIs, such as the number of created dashboards or queries, resonate more with a project mindset, not a product mindset. There is good detail on what was delivered, but not much insight into if it was adopted, helpful, or trustworthy enough. It is indicative of more vanity but less value.
Another challenge with traditional KPIs is the challenge of alignment. Traditional KPIs never reflect domain-specific details or structures of ownership, staying disconnected and centralised from the teams dependent on the data for consumption. As a consequence, the performance responsibility gets diluted, and the overall accountability framework goes for a toss.
The resulting paradox is pretty troubling: data teams look busy, but there is no clear visibility about the kind of traction their “work” is gaining. That is because real usage, user experience, or outcomes don’t have any sensible KPIs attached to them, which is bound to lead to a loss in value and leave the teams directionless.
As the world today inclines more towards data products and distributed ownership models and mechanisms, dependence on just traditional BI metrics is not going to cut it. There is a need for a new KPI framework to effectively capture performance, ensure alignment with domain requirements, and also demonstrate the data’s business impact.
[report-2025]
For building data products driven by solid purpose, all KPIs need to be knitted into each stage of the data product lifecycle. Every phase, from ideation to iteration, offers an opportunity to align technical progress with business requirements. This ensures that the overall product evolution is as per the expectations of real users.
[related-1]
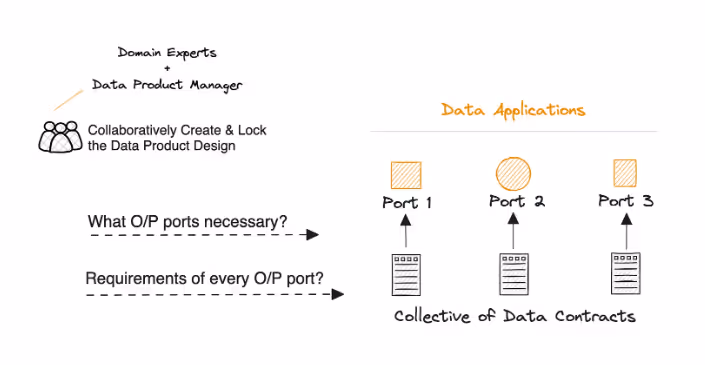
1. Ideation: In the earliest stage, the focus areas of KPIs are stakeholder alignment and business clarity. It offers details into the idea, if the problem is properly well-defined, and if the right users are involved in determining the value proposition. These are early indicators, and they play a key role in ensuring that the product has a purpose right from the get-go and is not subject to assumption.
At the end of this stage, a lot of information is available in the form of PRDs (Product Requirement Documents), each one with details about a particular domain. They provide insight into the state of available data, quality requisites that need to be taken care of, as well as policy constraints applicable to the data.
The PRDs, or data contracts, create a semantic data model, including all the involved entities, the relationship between each of them, as well as the appropriate KPIs to measure impact.
2. Development: During the development process, outcome-based KPIs help to evaluate the completeness of the SLA setup, data contract coverage, and also the inclusion of different governance controls such as lineage and validations. Such KPIs act as the added scaffolding, ensuring that there is a strong foundation, one that is strong, trustworthy, and aligned with expectations that were decided upon during the initial discussions.
When this stage reaches its conclusion, data products become a well-packaged bundle, a collection of all assets and resources for enabling the smooth function of these data products. The said bundle consists of different resources, standard interfaces, as well as programming patterns that can operate from inside the platform.

3. Deployment: At the time of deployment, data product KPIs can be used to measure the readiness and robustness of the product. Onboarding speed, integration success rates, change management impact, and data quality test coverage are not just metrics for show but reflective of whether the product is usable and stable at scale.
When the deployment stage is executed, enterprises get an activated data product, and the metrics mentioned above help in serving and evaluating all applications connected to the output ports. These apps can be a dashboard, a query interface, or even a CRM for that matter. The key element here is the data platform, responsible for proper functioning of the data product.

4. Adoption: Adoption is the area where a large number of traditional KPIs miss the mark, but modern, product-oriented metrics shine. This is where metrics like retention, usage frequency, active user roles, and user satisfaction roles become crucial. Setting the right KPIs at the time of adoption helps in understanding if the product is even solving the core problem that it wanted to address in the first place.
This stage also offers the right feedback, as well as insights on the metrics, code, infrastructure that influence various phases of the product lifecycle. With the KPIs mentioned above, the feedback also enables better and more polished iterations. Metrics such as feedback loop frequency, iteration velocity, and improvement timelines show the data team’s degree of responsiveness to user feedback, crucial for building trust and driving value.

More often than not, data KPIs stay a part of the operational checklist, such as system uptimes, query latency, and dashboard refresh rates. While there is no doubt that these KPIs are absolutely needed for scalability, they don’t deliver any real value to business leaders. If organisations are to shift to measuring outcomes instead of just tracking team activity, they need to adopt KPIs that measure the kind of impact each activity is creating. These can be measuring revenue, costs, speed, and risk.
When it comes to distinguishing between routine reporting pipelines and data products that are truly strategic, it is business-aligned KPIs that make a strong case for themselves. Here are a few instances:
As far as leadership teams are concerned, it is more valuable to them if they get updates through metrics such as churn reduction, lesser time-to-insight, or quicker response to market needs, for that matter, instead of dashboard refresh rates. The KPIs here play a realistic role in linking products to important strategic drivers, like user retention, operational flexibility, and growth.
Aligning KPIs with domain-specific goals is always a great idea. Dedicated performance indicators for marketing, finance, or supply chain teams act as potent tools to ensure accountability.
There is not just track of teams into what they are up to, but also the proof why metrics matter.
One of the most significant things about data product KPIs is that they are always as reliable as the visibility supporting them. Without proper details about the why, how, and by whom the data is being used, there is a risk that these KPIs will become mere assumptions and not a reflection of reality in the team.
This is the place where observability and metadata become key elements to ensure this never happens.
Information about data, or metadata, offers essential context. Schema definitions, usage frequency, ownership, and data classification are some of the areas where metadata insights are rich and informative. When such context acts as the foundation of setting up KPIs, each metric becomes governed by metadata in the process.
For instance, if usage metrics are linked with specific user personas, it becomes easier to evaluate whether data products are successfully serving their target audience. Such ownership metadata helps in setting up accountability when KPIs miss their mark.
On the other side, observability ensures visibility into real-time behaviours, which can include anomaly detection, lineage tracking, and monitoring freshness. A lot of times, these insights can be misleading.
A positive change in usage might reflect a duplication error. Another instance can be the rate of SLA adherence, which will be important only when the freshness and anomaly levels indicate that the product is usable and can be trusted.
When implemented together, metadata and observability ensure that data product KPIs indicate actual performance and not what was supposed to be the optimal performance. Both of them help in identifying the drift in trust or quality before the impact hits heavily on the enterprise.
By leveraging metadata and embedding observability measures into the data fabric, it becomes easier for organisations to shift from metrics without a focus on outcomes to evidence-backed indicators, clearing the gap between data operations and business results.
As data products scale and grow in an organisation, taking care of KPIs through spreadsheets and dashboards quickly becomes unfeasible. This is the ideal scenario for a Data Developer Platform or DDP. It transforms the tracking of KPIs into a platform-powered discipline from a fragmented activity.
With the integration of reusable assets, such as templates, policy-as-code, and lineage tracking into the DDP, enterprises can easily define, monitor, and evolve KPIs consistently, transforming them into highly integrated parts of the scaffolding of data products, making sure that each team works with the same standards and lines of expectations.
Policy-as-code enables the enforcement of quality metrics and governance centrally across all products in a data ecosystem, ensuring that each product aligns itself successfully with basic requirements. It could be for freshness; it could be for SLA compliance, or even access control; everything is enabled without any manual interference. As a result, audits become more scalable and practical.
The built-in data capabilities also bind everything back to their source systems, downstream users, and transformations. This full-stack lineage not only displays a considerable boost in the trust of data but also helps teams diagnose inconsistencies quickly and act with awareness.
KPIs don’t just remain afterthoughts with a DDP; they are effortlessly weaved into the development workflow.
It is this alignment between product, platform, and performance that transforms metrics into crucial drivers to lead to spectacular business value.
Designing the right data product KPIs is less about the quantity of them and more about the intention that backs this design process. If done in a compromising manner, KPIs become the hoarders of chaos, leading to misguided priorities, confusing teams, and leading to a diluted overall impact.
To avoid these compromises, certain aspects should be avoided:
1. Single Set of KPIs Throughout All Data Products
All data products have different purposes around which they revolve. Some offer customer-sided features, while some deliver operational insights in an actionable format. Trying to set up common KPIs across all data products misses the unique objectives of each and also undermines their specific performance.
2. KPI Overload
While a single set of KPIs won’t work, too many of them across teams dilute the focus and create a lot of confusion. Too many KPIs make it very tough for teams to wrap their heads around important things that matter. While there is no doubt that prioritising KPIs is important, the sharper they are, the higher the level of focus that can be ensured.
3. Confusing Activity with Impact
Keeping track of queries, dashboards, and other such activities can offer an illusion of progress. But, if they don’t deliver measurable business outcomes, they are not of much use. Measurement must not focus on just usage but also emphasise the value delivery parameter as well.
4. Keeping Business Stakeholders Away
It often happens that data teams isolate KPIs while defining them, missing the mark when it comes to proper business context. Not making domain stakeholders a part of the process leads to a high risk of measuring only what is convenient but not what is useful. Alignment with stakeholders is crucial in this aspect.
5. Treating KPIs as Static Entities
As a business evolves and the product matures away, the relevance of KPIs also fluctuates. In such a situation, failing to refine these KPIs over time can lead to misaligned measurements. This is why the evolution of KPIs should be a recurring practice.
Shying away from these common pitfalls ensures that the final KPIs are focused, stay aligned with business objectives, and reflect the proper degree of data product success.
As the world of data products evolves, KPIs are moving beyond their existence as mere dashboards, becoming tools for strategy in the process. It is reflective of the shift from just measuring outputs to keeping track of outcomes that are really crucial.
The success is significant because of three crucial elements: smart measurement, intentional design, and scalable enablement. In this equation, KPIs are right at the centre, leading the iterative process, helping ensure clarity, and validating the impact perfectly.
The most sensible KPIs tend to go beyond just technical health. Adoption rate, data quality, insight delivery time, as well as SLA reliability are some of the metrics that reveal if a data product is truly helping teams in making better and quicker decisions.
You can think of data product KPIs as proof points. They don’t just keep a check and track usage, but they also demonstrate how data products help in pacing the decision-making, shows measurable business value such as cost savings, and also cuts down manual work.
Your Copy of the Modern Data Survey Report
Better decisions start with shared insight.
Pass it along to your team →
Your Copy of the Modern Data Survey Report
Better decisions start with shared insight.
Pass it along to your team →


Find more community resources
Modern Data 101 is a movement redefining how the world thinks about data. A community built by the same team behind the world’s first data operating system, Modern Data 101 sits at the intersection of data, product thinking, and AI. Spread across 150+ countries, the community brings together a global network of practitioners, architects, and leaders who are actively building the next generation of data systems.
At its core, Modern Data 101 exists to simplify the journey from raw data to tangible and observable impact. It advocates high-potential data systems and next-gen architectures to unify and activate insights and automation across analytics, applications, and operational workflows at the edge.
In a world shifting from data stacks to AI ecosystems, Modern Data 101 helps teams not just navigate the change but lead it.

Find all things data products, be it strategy, implementation, or a directory of top data product experts & their insights to learn from.
Connect with the minds shaping the future of data. Modern Data 101 is your gateway to share ideas and build relationships that drive innovation.
Showcase your expertise and stand out in a community of like-minded professionals. Share your journey, insights, and solutions with peers and industry leaders.


