

Access full report
Oops! Something went wrong while submitting the form.

🤍

Facilitated by The Modern Data Company in collaboration with the Modern Data 101 Community
Latest reads...
%20(1).png)
.png)
.png)
TABLE OF CONTENT


Data sharing and data adoption are where data truly comes alive. Not in storage. Not in pipelines. But at the moment it’s put to use by people, systems, or models. This is the real turning point where data moves from being passive infrastructure to active leverage.
The mechanisms we put in place to enable this, catalogs, contracts, access protocols, adoption workflows, aren’t peripheral. They are the foundational elements of data activation.
Regardless of whether the end consumer is an AI agent, a business user, or an application (data/AI), this layer becomes the interface where data is made legible, relevant, and actionable.
This is why the technology, process, and culture surrounding data sharing must evolve. As a bridge instead of backend enablement. Bridging control and creativity, governance and application, human context and machine execution.
This piece covers:
- Recognizing recurring data-sharing challenges through scenario-based framing.
- Learning prerequisites, required capabilities, risk factors, and meaningful metrics for each context.
This piece bridges two complementary components: the definition of requirements and operating models, and the exploration of implementation strategies and architectural patterns.
The scenarios described are not intended as rigid classifications. Real-world environments are often more nuanced, and hybrid situations are the norm rather than the exception. Still, by laying out clear, bite-sized scenarios, this piece should give you something practical to work with: a reference you can lean on without getting buried in complexity. The idea is to make decisions feel a little more straightforward, and a lot more confident.
The objective is not to force the reader into a single predefined model, but rather to help identify the dominant traits of their starting point, even if partial or imperfect.
This non-prescriptive approach liberates you from rigid structures, allowing you to use this awareness to guide the strategic and architectural choices.
Each scenario follows a consistent structure for quick understanding and application:
This modular structure allows you to read each scenario independently, compare them, and reflect critically on which elements most apply to your current environment.
The table below summarizes typical organizational phenomena ("triggers") that suggest the need to activate or prioritize each specific scenario:
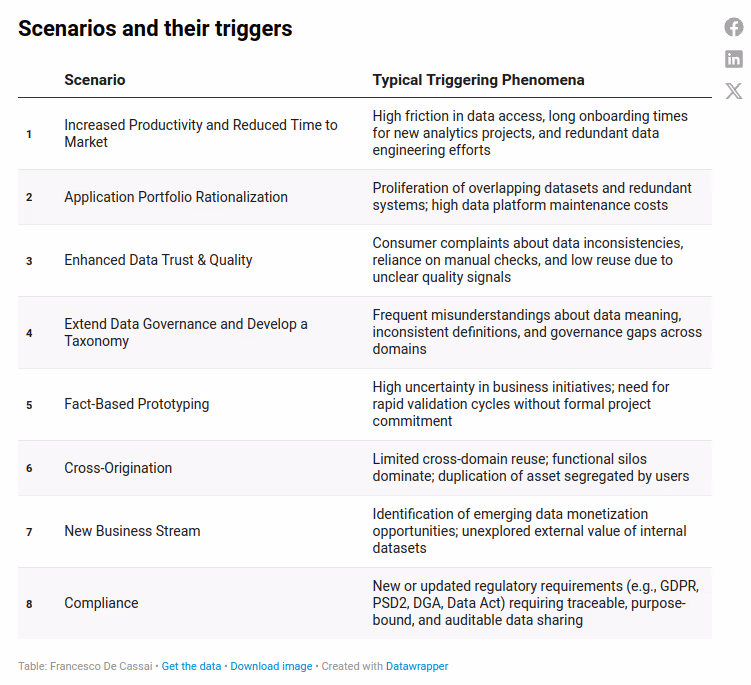
In this piece, we’ll spotlight the first three scenarios.
Part 2 will sketch out the rest of the landscape.
In most data projects, the bottleneck is not the technology; it’s the friction in finding, evaluating, and accessing the correct data. The execution phase often starts with uncertainty: Where is the data we need? Who owns it? Is it current? Is it immediately usable, or will it require cleaning, transformation, or re-ingestion?
These questions are rarely answered upfront. Teams waste days or weeks chasing down undocumented datasets, reverse-engineering fields, or waiting for someone to approve access. Even worse, once a dataset is found, its usability depends on oral history, personal knowledge, or internal shortcuts that do not scale. As a result, the early stages of every project include a substantial portion of “data archaeology”: an expensive, untracked cost hidden behind project delays and duplicated work.

This pattern is not accidental: it is the consequence of environments where data exists, but is not operationalized as a reusable product. Each new initiative starts from scratch without a structured method to expose, evaluate, and provision information assets. This creates a paradox: the organization is rich in data but poor in data access.
From a systemic perspective, this inefficiency compounds over time. As the number of initiatives grows, so does the waste, leading to saturation of expert teams, inconsistent outcomes, and a lack of confidence in the data landscape. It also pushes skilled professionals into low-value tasks, simply because there is no infrastructure to support reusable knowledge.
TIP, DATA PREVIEW: Previewing a dataset: just glancing at its structure, a few rows, and some basic metadata might feel like a small thing. But it changes everything. It gives users just enough context to know if the data’s even worth pursuing, without kicking off a full access process or pulling in extra teams.
That quick look often saves everyone from misalignment, back-and-forth, and time they didn’t need to spend. It doesn't replace governance but often clarifies ambiguities and makes conversations more concrete for producers and consumers.
A marketplace mitigates this inefficiency by exposing the organization’s data assets in a discoverable, structured, and queryable format.
The search phase is drastically reduced or eliminated through metadata, preview capabilities, and filtering mechanisms.
In some cases, access to low-risk products can even be automated, enabling teams to move forward without blocking dependencies. For development teams under pressure to deliver faster, this shift can unlock significant productivity gains and shorten time to market.
The minimal foundations you need in place before launching the scenario are:
The capabilities that will necessarily need to be implemented for the scenario are:
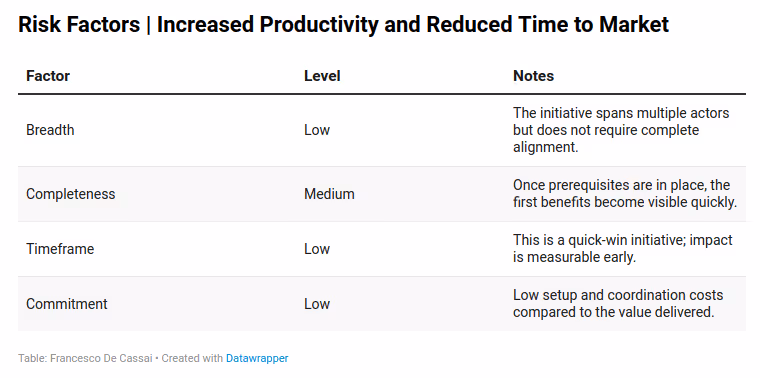
Here are the key metrics that should be used to monitor the progress of the scenario:
Over time, many organizations accumulate overlapping data pipelines, reporting solutions, and siloed access layers: each tied to specific tools, projects, or departments. What begins as pragmatic problem-solving eventually becomes unsustainable: duplicated datasets, multiple versions of the truth, redundant ETL jobs, and mounting operational costs.
This scenario addresses that exact pain: reducing waste and increasing consistency across the data landscape. The problem is rarely technical: it’s about visibility and governance. Teams don’t reuse what they can’t find and often rebuild what already exists, simply because no shared layer makes data products findable, comparable, or trustworthy.

Portfolio rationalization isn’t about shutting things down for the sake of it. It’s about making what exists visible, spotting overlaps, checking what’s actually being used, and guiding consolidation in a way that doesn’t break delivery. The goal is clarity so you can cut down on duplication and shadow systems without lighting fires elsewhere.
A marketplace reveals the application and data landscape. Making published data products visible, searchable, and versioned simplifies identifying duplication and fragmentation across domains. When a dataset appears multiple times with different owners, descriptions, or definitions, the marketplace highlights the issue.
It acts as a governance tool to assess and monitor overlaps and encourages teams to converge voluntarily, reducing friction through transparency rather than enforcement.
Most importantly, the marketplace provides the infrastructure to retire products safely: if deprecated, consumers are notified, usage is tracked, and alternatives are suggested within the interface. This transforms rationalization from a top-down mandate to an operational reality practice.
The minimal foundations you need in place before launching the scenario are:
The capabilities that will necessarily need to be implemented for the scenario are:
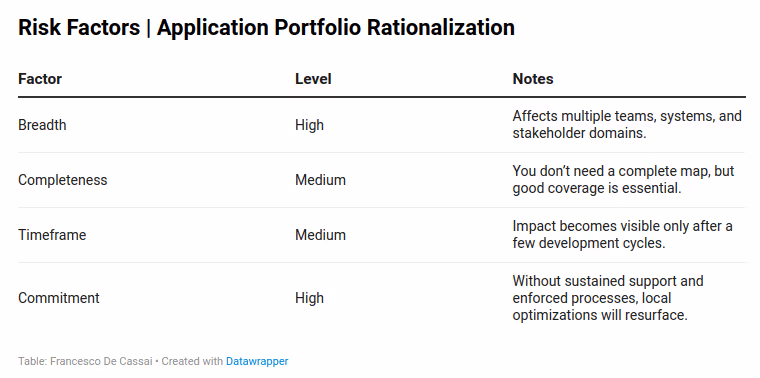
Here are the key metrics that should be used to monitor the progress of the scenario:
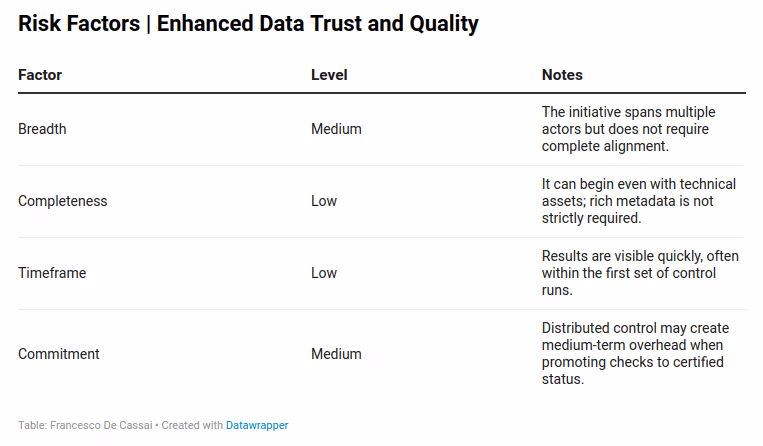
In many organizations, structured and pervasive data quality practices are rare. Where they exist, they are often limited to regulatory obligations, past negative experiences in specific domains, or isolated initiatives without broader adoption.
Data democratization alone does not solve the cultural challenges around data quality, but it can at least increase pervasiveness by reducing the unit cost of quality control.
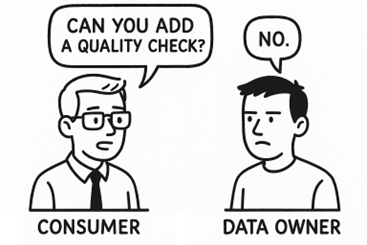
Consumers, unlike producers, are directly interested in knowing the quality of the data they consume, whereas producers often perceive quality checks as unnecessary fine-tuning or additional burden.
Another relevant phenomenon is that consumers often propose valid quality controls outside the producer’s sphere of competence. Even with the best intentions, producers may be unable to validate or fully interpret such controls. A classic example is customer master data, where different domains (sales, marketing, legal) require domain-specific validations that are difficult to harmonize upstream.
The rise of AI intensifies this challenge by increasing demand for purpose-fit or "good enough" data. Data owners often lack the time, incentives, or technical understanding to address such requirements within operational timeframes. Moreover, quality improvement processes are frequently bureaucratic, involving multiple layers of validation that discard, rather than absorb, valuable feedback from consumers.
TIP – Fit for Purpose, Not Perfect: In data sharing, perfection is rarely the goal and often a distraction. What truly matters is whether a dataset is good enough for the intended use. A time-lagged feed may be acceptable for reporting but unusable for AI; a dataset with incomplete lineage may still safely support exploratory analysis.
The concept of fit for purpose reminds us that quality is not absolute but contextual. This is precisely where data contracts play a critical role: they formalize expectations, declare known limitations, and define the acceptable quality envelope for each use case. Trust grows not from chasing universal standards but from making constraints transparent and negotiable.
Improving trust and quality here isn’t about chasing some perfect state. It’s about putting systems in place that make things clear so consumers can see what they're working with, understand the signals, and decide if the data’s good enough to rely on. The focus is on visibility and steady upkeep instead of perfection.
An important concept emerging in modern data-sharing practices is data veracity.
Veracity refers to a new way of thinking about data quality: instead of filtering, cleaning, or "fixing" datasets upstream, the focus shifts to exposing the data’s real state, including strengths, limitations, known risks, and uncertainties, through explicit metadata and quality signals.
In a veracity-oriented model, the data supply chain does not hide imperfections; it documents them and makes them accessible to consumers. Every dataset is delivered with its context: source information, validation coverage, sampling biases, update policies, and known gaps.
This approach gives consumers what they actually need: enough clear information to make informed, risk-aware calls, instead of just hoping everything behind the scenes is flawless. It’s not a requirement, but bringing a veracity mindset into the mix comes with a bunch of real-world advantages:
In short, veracity does not mean delivering perfect data but means delivering transparent data, strengthening both autonomy and trust across the data-sharing ecosystem.
Improving trust and quality is not only about what controls are in place, but also about how transparently those controls are exposed to consumers.
A marketplace provides the perfect surface for this. It becomes the natural place where producers can publish objective signals of quality: validation checks, SLA compliance, and maturity levels, without resorting to one-off reports or isolated tools.
Trust becomes visible and cumulative by integrating preview features, feedback loops, and certification workflows into the marketplace experience. Consumers can see whether a product is certified, if it’s actively monitored, and how often it’s updated. And if something is missing or unclear, they have a structured channel to ask, rate, or report. The marketplace doesn't just expose data but reveals how that data behaves, helping to build a reliable foundation for data-informed decisions.
The minimal foundations you need in place before launching the scenario are:
The capabilities that will necessarily need to be implemented for the scenario are:
Here are the key metrics that should be used to monitor the progress of the scenario:
This piece is not meant to offer a complete taxonomy of everything you could do with data sharing. That would be impossible and misleading. Instead, it proposes a curated set of recurring situations, selected not for their theoretical purity, but for their practical relevance.
You’ve seen organizations that want to monetize data before having internal trust. Others talk about reuse, but can't find what they’ve already built. Some are driven by regulatory pressure, others by experimentation. All of them are real. All of them start messy.
Scenarios help bring structure to that mess. They are a way of thinking a scaffolding to recognize what kind of challenge you’re facing and what it will take to address it.
They let you:
These scenarios are not mutually exclusive. In fact, they often coexist and compete.
A team may want to accelerate time to market, while governance needs stronger documentation. Compliance may demand control, while business wants openness. The key is to recognize the dominant constraint in each phase and act accordingly.
Architecture will follow that constraint; it has to. But if you skip the reflection, your architecture may be elegant and useless. So treat these scenarios not as models to implement, but as decision-making frames. Use them to:
We’ll come back in the next part to highlight a few more data sharing scenarios and how tools, people, and processes fall into place to enable them despite the mess.
Thanks for reading Modern Data 101! Subscribe for free to receive new posts and support our work.
If you have any queries about the piece, feel free to connect with the author(s). Or feel free to connect with the MD101 team directly at community@moderndata101.com 🧡

Bonus for sticking with us to the end!
Here’s your own copy of the Actionable Data Product Playbook. With 1500+ downloads so far and quality feedback, we are thrilled with the response to this 6-week guide we’ve built with industry experts and practitioners.
Stay tuned on moderndata101.com for more actionable resources from us!

Your Copy of the Modern Data Survey Report
Better decisions start with shared insight.
Pass it along to your team →
Your Copy of the Modern Data Survey Report
Better decisions start with shared insight.
Pass it along to your team →


Find more community resources
Modern Data 101 is a movement redefining how the world thinks about data. A community built by the same team behind the world’s first data operating system, Modern Data 101 sits at the intersection of data, product thinking, and AI. Spread across 150+ countries, the community brings together a global network of practitioners, architects, and leaders who are actively building the next generation of data systems.
At its core, Modern Data 101 exists to simplify the journey from raw data to tangible and observable impact. It advocates high-potential data systems and next-gen architectures to unify and activate insights and automation across analytics, applications, and operational workflows at the edge.
In a world shifting from data stacks to AI ecosystems, Modern Data 101 helps teams not just navigate the change but lead it.

Find all things data products, be it strategy, implementation, or a directory of top data product experts & their insights to learn from.
Connect with the minds shaping the future of data. Modern Data 101 is your gateway to share ideas and build relationships that drive innovation.
Showcase your expertise and stand out in a community of like-minded professionals. Share your journey, insights, and solutions with peers and industry leaders.


